Summary Statistics
Summary statistics give valuable insights as one of the first steps in data engineering after the data is gathered. Statistics help to assess data quality and diversity. Data discovery with statistics is a common first activity and there are many excellent packages to help with the standard analysis.

We will explore the Python packages that are commonly used for statistical analysis and data exploration including numpy, and pandas.


You may need to install Python packages from the terminal, Anaconda prompt, command prompt, or from the Jupyter Notebook.
Pandas

Pandas imports data, generates summary statistics, and manipulates data tables. There are many functions that allow efficient manipulation for the preliminary steps of data analysis problems. Run the code below to read in the smallpox data file as a DataFrame data. The data.head() command shows the top rows of the table.
data = pd.read_csv('http://apmonitor.com/pds/uploads/Main/smallpox.txt')
data.head()
This prints the top rows of the table with the top 5 rows. You can also see the end with data.tail() or change the number of rows with data.head(10).
        week state  state_name   disease  cases  incidence_per_capita
   0  192801    AL     ALABAMA  SMALLPOX      1                  0.04
   1  192801    AR    ARKANSAS  SMALLPOX      7                  0.38
   2  192801    AZ     ARIZONA  SMALLPOX      0                  0.00
   3  192801    CA  CALIFORNIA  SMALLPOX     18                  0.34
   4  192801    CO    COLORADO  SMALLPOX     31                  3.06
The data.describe() command shows summary statistics.
This produces basic summary statistics.
                   week         cases  incidence_per_capita
   count   50916.000000  50916.000000          50916.000000
   mean   193809.850636      4.572787              0.249108
   std       591.489888     15.062277              0.824331
   min    192801.000000      0.000000              0.000000
   25%    193312.000000      0.000000              0.000000
   50%    193819.000000      0.000000              0.000000
   75%    194324.000000      2.000000              0.090000
   max    195250.000000    350.000000             50.360000
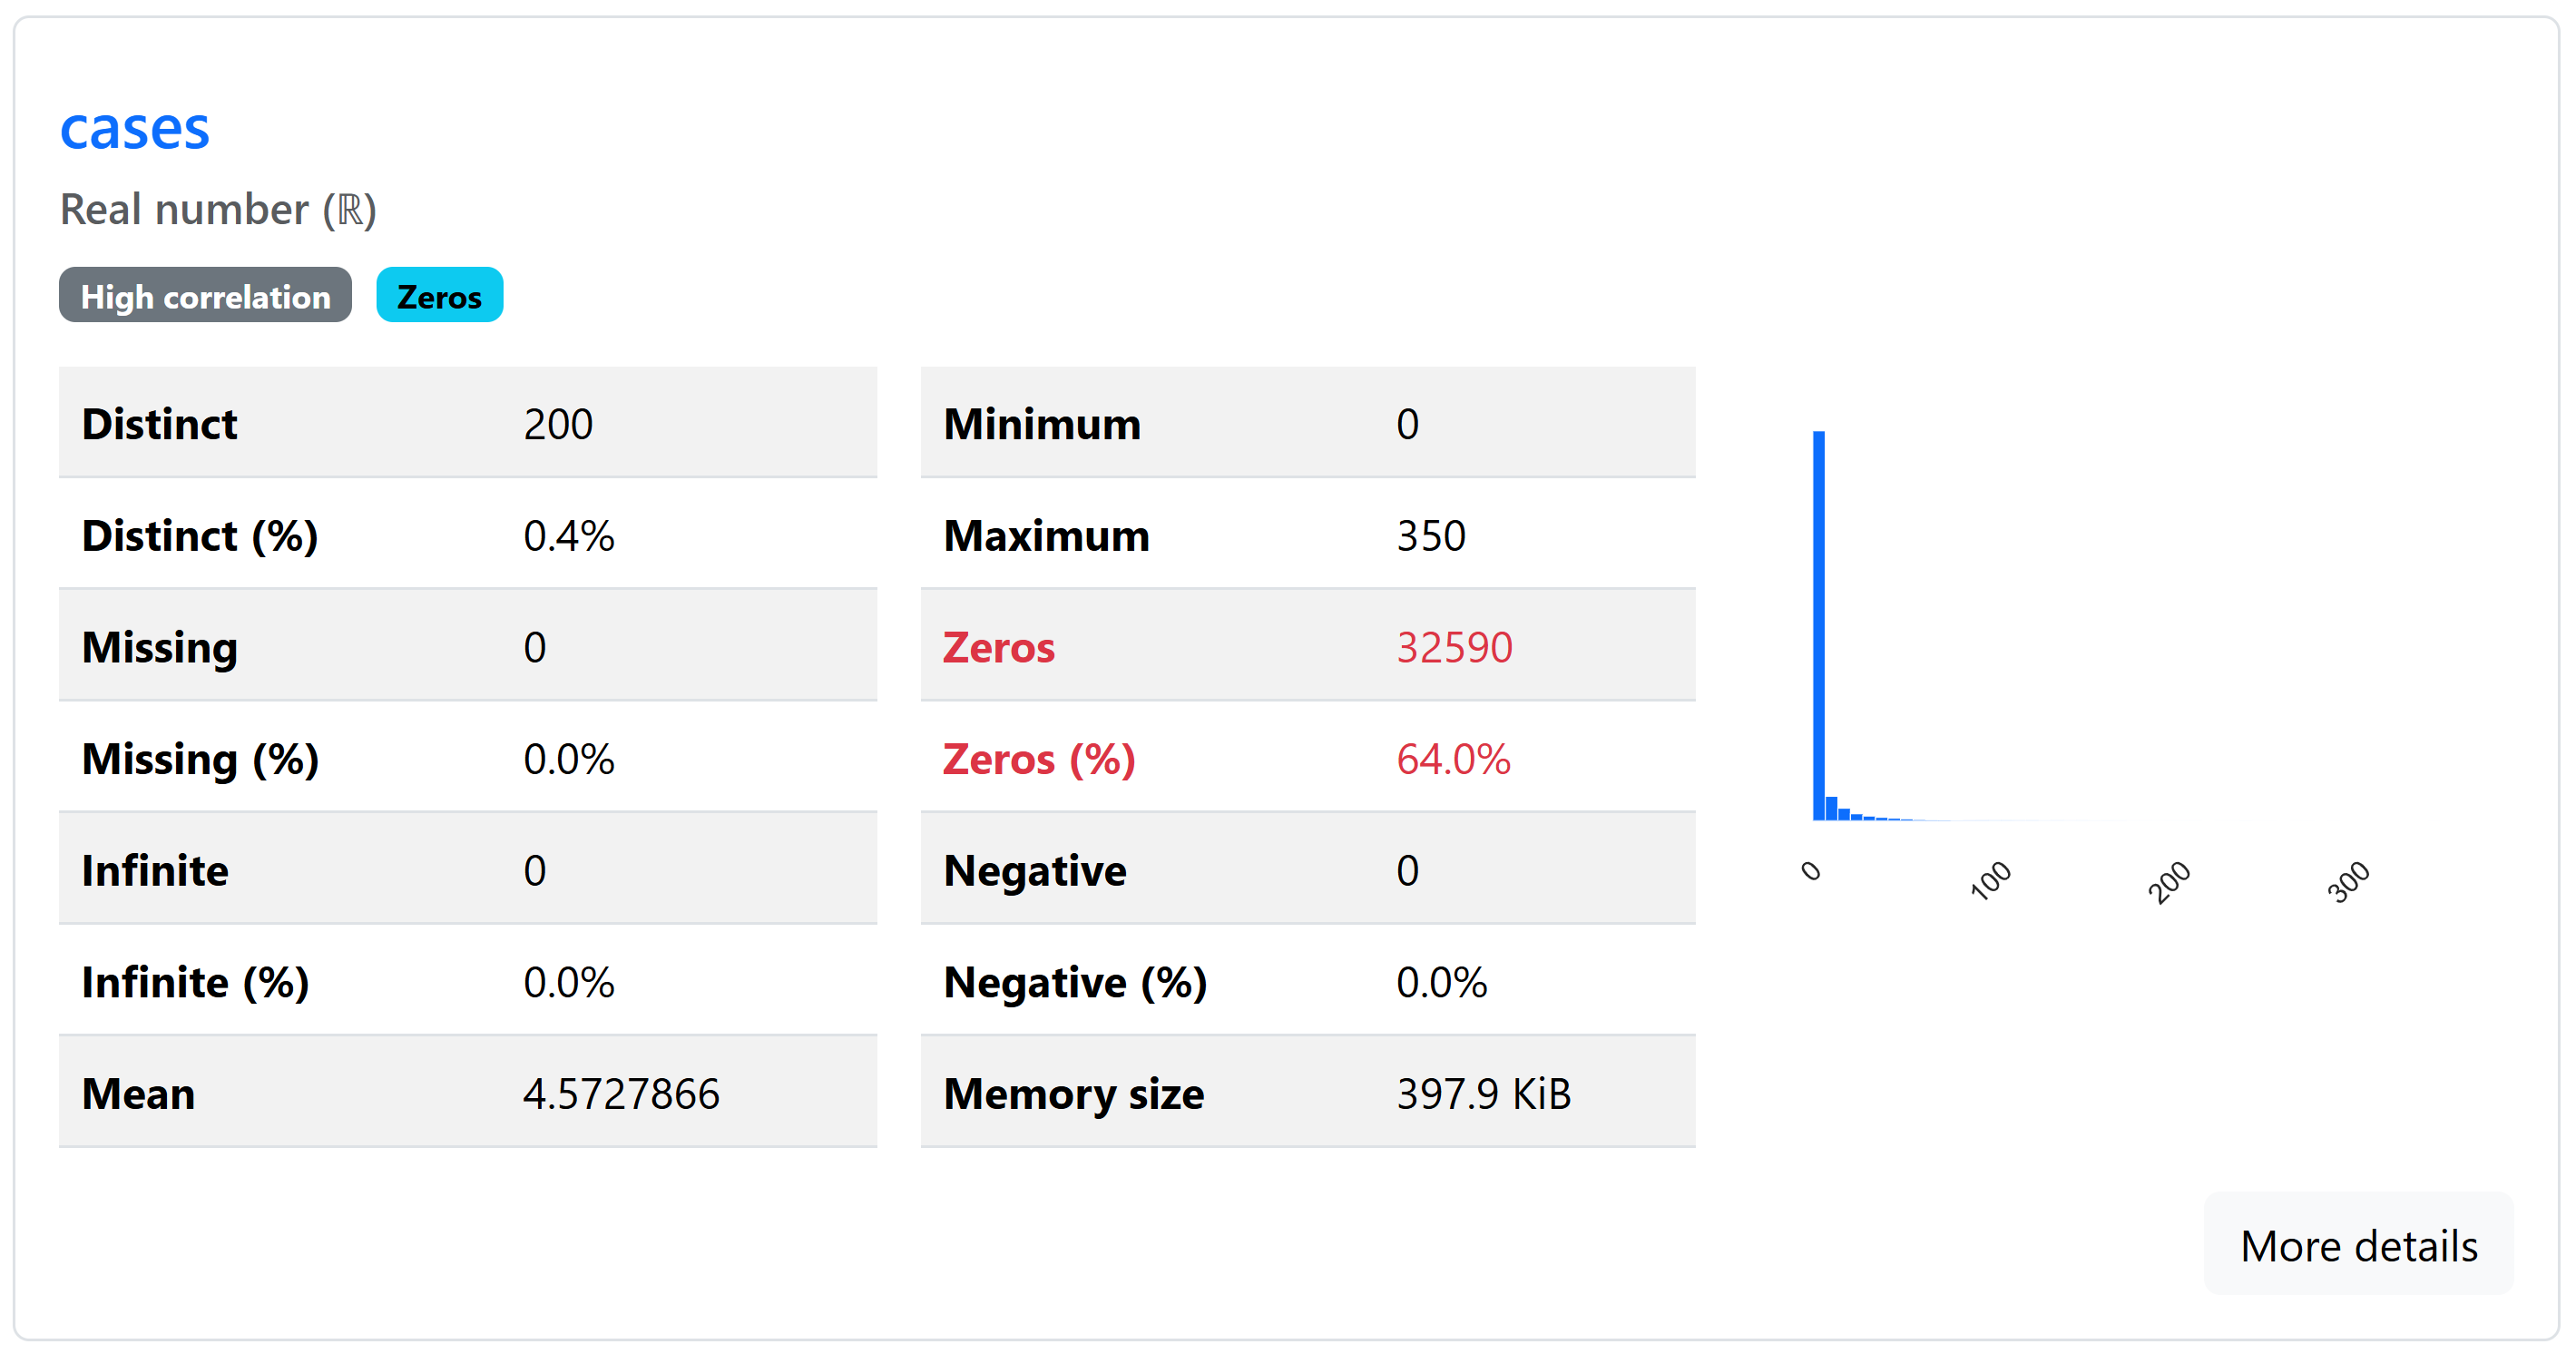
Pandas Profiling
Pandas Profiling (ydata-profiling) is a data analysis tool for a more in-depth summary of the data than the describe() function. Install the package with
pip install ipywidgets ydata-profiling
You need to restart the kernel before proceeding. The install only needs to run once.
profile = ProfileReport(data, explorative=True, minimal=False)
After you load ProfileReport and create a new profile to analyze the data. Some of the functions take a long time with a large data set. Two methods for dealing with large data sets are to:
- Sub-sample the data sets such as with data = data[::10] to take every 10th row.
- Use the minimal=True option to avoid analysis that is slow with large data sets.
View the profile report in the Jupyter Notebook with profile.to_widgets() or export to html file with profile.to_file("analysis.html").
Activity


This activity uses summary statistics to analyze disease spread in the US states with smallpox data. The introductory exercise analyzes data specific to the state of Utah.
Summary statistics are created to analyze another US state besides the state of Utah. Basic mathematical operations are used to create trends that describe the disease spread.
Further Reading
- Gu, M., Math and Statistics Review, Apr 25, 2020.
- Brownlee, J., Statistics for Machine Learning (7-Day Mini-Course), Aug 8, 2019.

Solutions

✅ Knowledge Check
1. What is one of the primary uses of summary statistics in data engineering?
- Incorrect. Summary statistics are not used for rewriting or recreating data.
- Correct. Summary statistics provide valuable insights as one of the initial steps in data engineering, helping to assess data quality and diversity.
- Incorrect. While data manipulation might involve modifying structures, summary statistics are about understanding the data's nature and distribution.
- Incorrect. While graphical representation might utilize summary statistics, they have broader applications.
2. Which Python library mentioned is primarily used for generating summary statistics and manipulating data tables?
- Incorrect. While numpy is useful for numerical operations in Python, it's not the primary tool for generating summary statistics on data tables.
- Incorrect. Anaconda is a distribution of Python and R for scientific computing and data science, not a specific library for summary statistics.
- Correct. Pandas is widely used for data manipulation and generation of summary statistics, especially with its DataFrame functionality.
- Incorrect. Jupyter Notebook is an interactive computing environment, not a specific library for generating summary statistics.
