Final Project
The final project is to use data science skills to solve an engineering problem. You are designing a next-generation cell phone and the battery and processor on the cell phone generate a lot of heat. You want to make sure that the material between them will prevent over-heating of the battery by the processor.

This study will help you answer questions about material properties for predicting the temperature of the battery and processor.

The analysis uses data from the temperature control lab to determine the effects of thermal conductivity of copper, plastic, and cardboard.
Before beginning the final project, start with the background information on heat transfer by three different modes:
- Convection
- Conduction
- Thermal Radiation
This project is to determine the effect of thermal conductivity of several materials. Thermal conductivity is how well a material conducts or insulates against heat transfer. The specific heat transfer project shows how to apply data science to solve an important problems with methods that are applicable to many different applications.

Objective
Collect and analyze data from the TCLab to determine the effect of thermal conductivity of three materials (metal, plastic, and cardboard) that are placed between two temperature sensors. Create a predictive model to analyze heat transfer and temperature changes.
Background on Heat Transfer
There are several modes of heat transfer including radiative, convective, and conductive. Radiative heat transfer is from the motion of particles and emitted as electromagnetic photons primarily as infrared radiation. Convective heat transfer is with the surrounding fluid such as air. Convection can be forced such as from a blower or natural such as in quiescent conditions. Conductive heat transfer is through solid contact as the energy transfers away but, unlike convection, the contact material is stationary.

For each situation, determine which form best describes the heat transfer.
Hair is dried with a blow dryer
A pan is heated on a gas stove
Food is cooked in the hot pan
Sunlight warms the ground
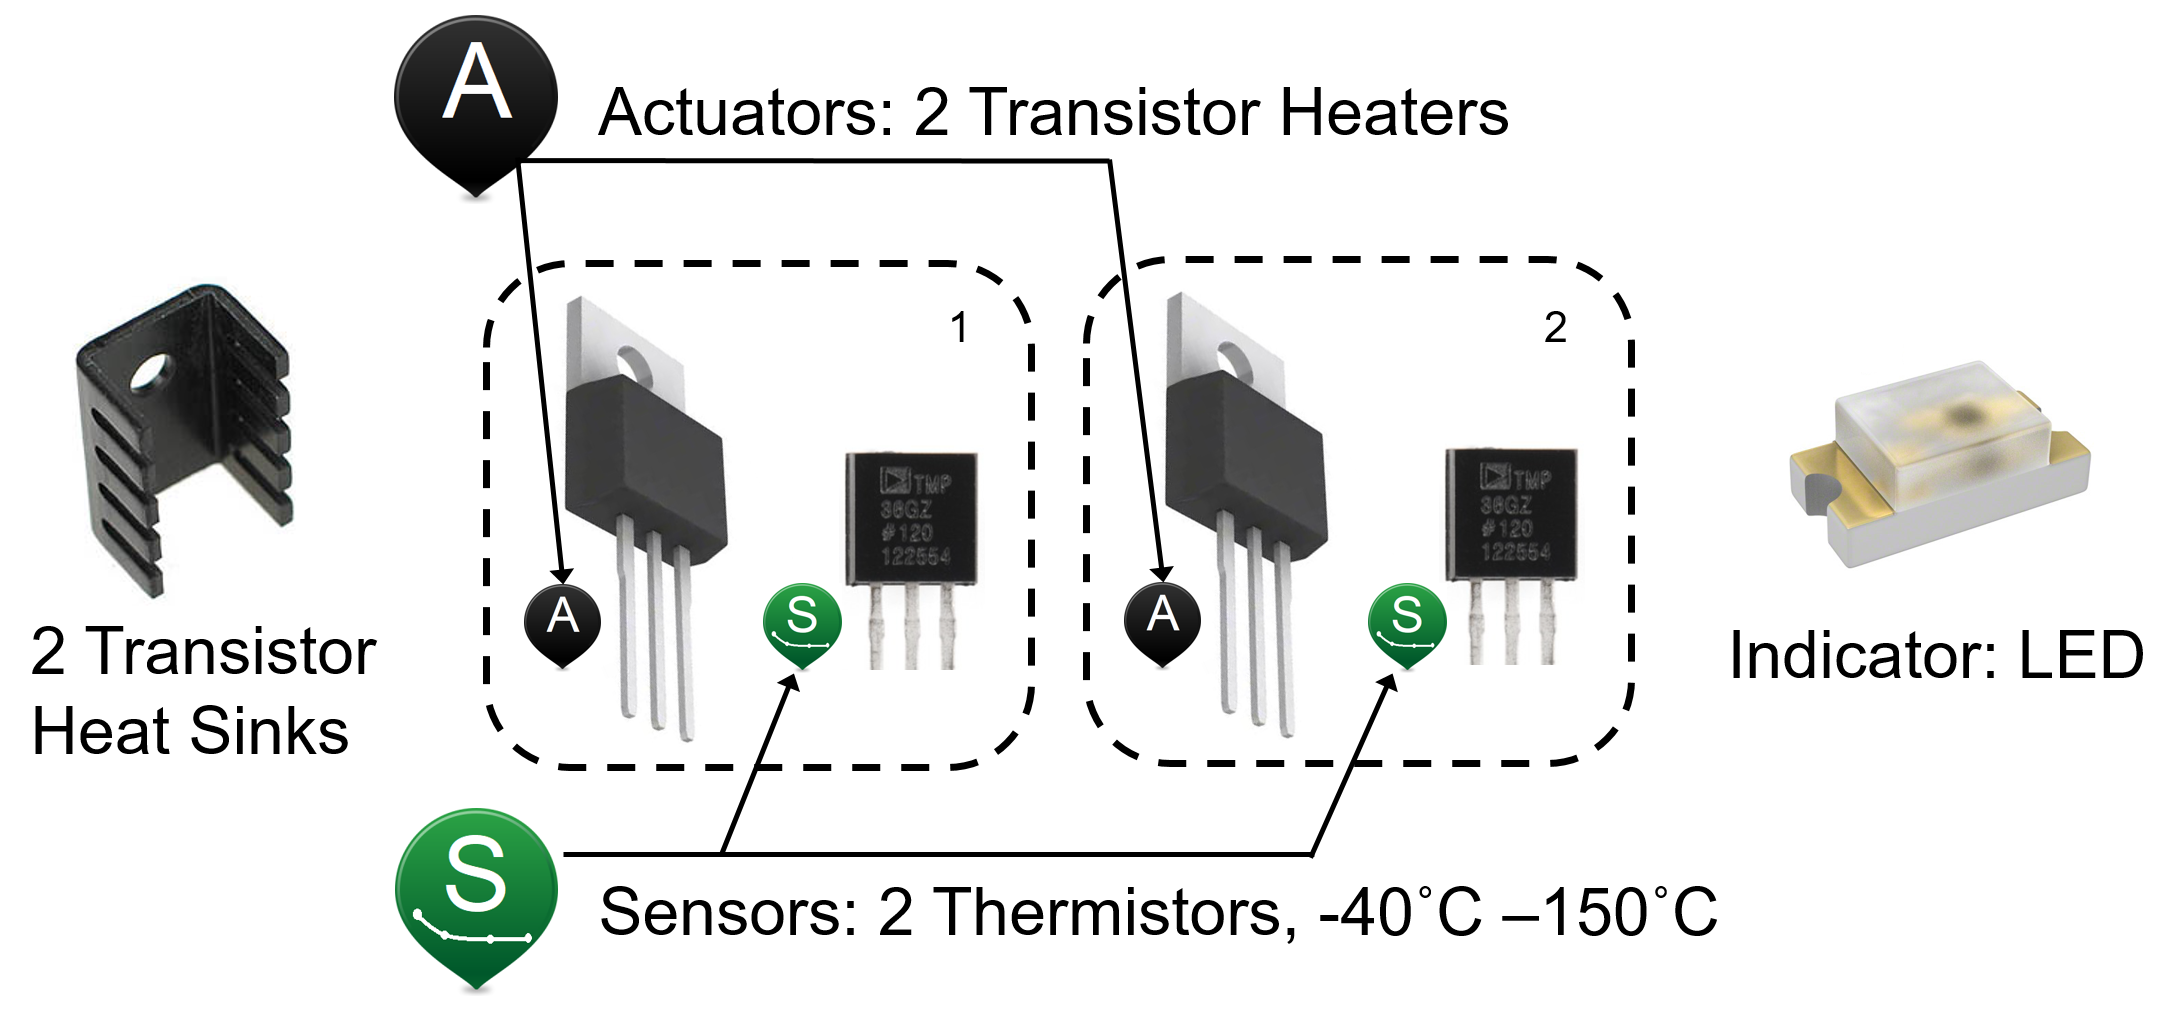
TCLab Heaters
The temperature of transitor increases as electrical current flows through the small device. Energy is dispersed away from the transitor with two primary mechanisms: convection and radiation. The amount of heat lost by convection $\left(q_{conv}\right)$ is proportional to the temperature difference between the transistor $\left(T_x\right)$ and the surrounding air temperature $\left(T_{air}\right)$.
$q_{conv} = h \, A \, \left(T_{air}-T_x\right)$
A finned heat sink is attached to the transistor to increase the surface area and increase the heat removal. A temperature sensor is attached to the transistor to monitor the temperature.

The surface area $(A)$ of the transistor and heat sink is about 12 $cm^2$. A convective heat transfer coefficient $(h)$ for quiescent air is approximately 10 $\frac{W}{m^2\,K}$. At lower temperatures, the heat generated by the transistor transfers away from the device primarily by convection but radiative heat transfer $\left(q_{rad}\right)$ may also be a contributing factor. The surrounding temperature $\left(T_\infty\right)$ is that of objects such as walls or the ceiling. In this case is the same as the air temperature.
$q_{rad} = \epsilon \, \sigma \, A \, \left(T_\infty^4-T_x^4\right)$
Some of the constants needed for the transistor and finned heat sink are shown in the table below. Some of the constants in the table are not needed for this calculation.
| Quantity | Value |
|---|---|
| Heat capacity ($C_p$) | 500 $\frac{J}{kg\,K}$ |
| Air Temperature ($T_{air}$) | 20 $^oC$ |
| Surrounding Temperature ($T_\infty$) | 20 $^oC$ |
| Surface Area ($A$) | 1.2e-3 $m^2$ (12 $cm^2$) |
| Mass ($m$) | 0.004 $kg$ (4 $gm$) |
| Heat Transfer Coefficient ($h$) | 10 $\frac{W}{m^2\,K}$ |
| Emissivity ($\epsilon$) | 0.9 |
| Stefan Boltzmann Constant ($\sigma$) | 5.67e-8 $\frac{W}{m^2-K^4}$ |

Calculate Convection and Radiation
Calculate the amount of heat lost by convection and by radiation at temperatures between 20 $^oC$ and 200 $^oC$. Create a plot that shows the heat transfer by each for convection and radiation expressions.
convection = h*A*(Ta-Tx)
radiation  = eps*sigma*A*(Tinf**4-Tx**4)
import numpy as np
%matplotlib inline
import matplotlib.pyplot as plt
import pandas as pd

Ta = 20 + 273.15    # Ambient air temperature (K)
Tinf = Ta           # Surrounding temperature (K)
h = 10.0            # Heat Transfer Coefficient (W/m^2-K)
m = 4.0/1000.0      # Mass (kg)
Cp = 0.5 * 1000.0   # Heat capacity (J/kg-K)
A = 12.0 / 100.0**2 # Surface Area (m^2)
eps = 0.9           # Emissivity
sigma = 5.67e-8     # Stefan-Boltzman

T = np.linspace(20,200) # Temperature (degC)
Tx = T + 273.15     # Temperature (K)

# Energy Balance
convection = h*A*(Ta-Tx)
radiation  = eps*sigma*A*(Tinf**4-Tx**4)

# Save values
pd.DataFrame(np.transpose([-convection, -radiation, T])\
             ,columns=['Convection','Radiation','Temperature'])\
             .to_csv('XX-heat_transfer.csv',index=False)

#Plotting
plt.figure(figsize=(10,5))
plt.plot(T,-convection,'b-',label='Convection')
plt.plot(T,-radiation,'r--',label='Thermal Radiation')
plt.xlabel('Temperature $^oC$')
plt.ylabel('Heat Loss (W)')
plt.legend()
plt.show()
What is the relative importance of heat transfer by convection and radiation at low (<80 $^oC$) and high (>180 $^oC$) temperature. Which heat transfer mode increases relatively more as the temperature increases?
Use the plot above and make a function that prints values of the graph to determine the temperature where radiative heat transfer is greater than the heat lost by convective heat transfer.
# Run the graph code above before starting this section
data=pd.read_csv('XX-heat_transfer.csv')
data.head()
Equation for convection heat loss: $q_{conv} = h \, A \, \left(T_{air}-T_x\right)$
Equation for radiation heat loss: $q_{rad} = \epsilon \, \sigma \, A \, \left(T_\infty^4-T_x^4\right)$
Which of these factors could increase only thermal radiation?
Which of these factors could increase both thermal radiation and convection?
Thermal Conductivity Test
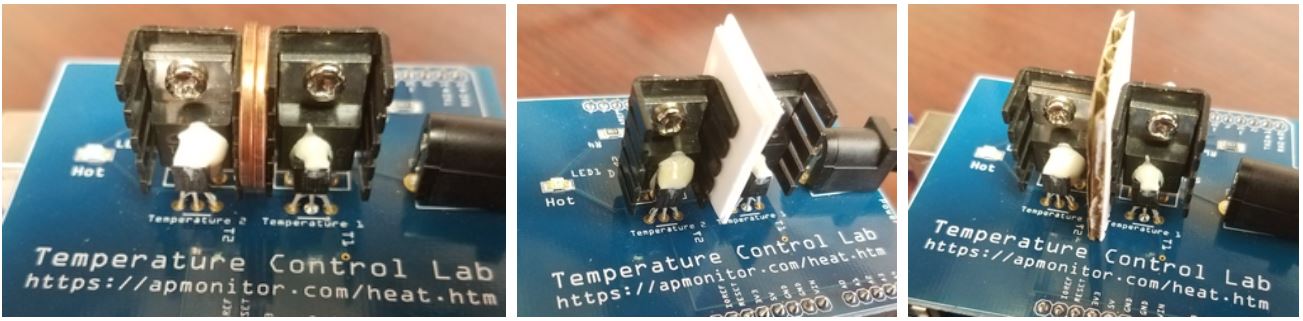
Insert metal coins (or coin), plastic, and cardboard in between the two heaters so that there is a conduction path for heat between the two sensors. The temperature difference and temperature levels are affected by the ability of the material to conduct heat from heater 1 and temperature sensor $(T_1)$ to the other temperature sensor $(T_2)$.
When changing out the materials between the heaters, wait until the heaters have cooled off and avoid touching a hot surface. There are thermochromic paint dots on the heaters that turn pink when the heaters are above 37$^oC$ (99$^oF$).

Do not touch the heaters or the material between the heaters directly after the test. Blowing on the heaters helps to cool them quickly.

Turn on heater 1 to 100% and record $T_1$, $T_2$, and the temperature difference $\Delta T = T_1-T_2$ every 10 seconds for 8 minutes for each material (6 x 8 + 1 = 49 data points). The objective is to observe the temperatures at steady state conditions and longer or shorter tests may be required to reach steady state. For each material test, record the values at the end after the system has reached a steady state equilibrium.
Analyze Data
Locate the thermal conductivity of the materials inserted between the heaters. Below are some common materials with thermal conductivities.
| Material | Thermal Conductivity $\left(\frac{W}{m\;K}\right)$ |
|---|---|
| Aluminum | 237 |
| Cardboard / Paper | 0.05 |
| Copper (US Penny <1981) | 401 |
| Gold | 318 |
| Plastic (LDPE) | 0.36 |
| Silver | 429 |
| Stainless Steel | 18 |
| Steel (<0.5% Carbon) | 54 |
| Zinc (US Penny >1983) | 116 |
Create a semi-log x plot of the thermal conductivity versus $T_1$, $T_2$, and $\Delta T$ using an average of the last 6 data points for each of the plastic, metal, and cardboard tests. Use plt.semilogx to create the plot with thermal conductivity as the first argument and the temperatures as the second argument.
Create a linear regression for $\log_{10}$(thermal conductivity) versus $T_1$, $T_2$, and $\Delta T$. Predict the steady state $T_1$, $T_2$, and $\Delta T$ for stainless steel with $k=18\frac{W}{m\;K}$ using the linear model. Display the slope of each of the linear models for $\log_{10}$(thermal conductivity) versus $T_1$, $T_2$, and $\Delta T$. Based on heat transfer principles, explain the sign (positive or negative) of the slope. In other words, why does the temperature either increase or decrease with increasing thermal conductivity?
Energy Balance
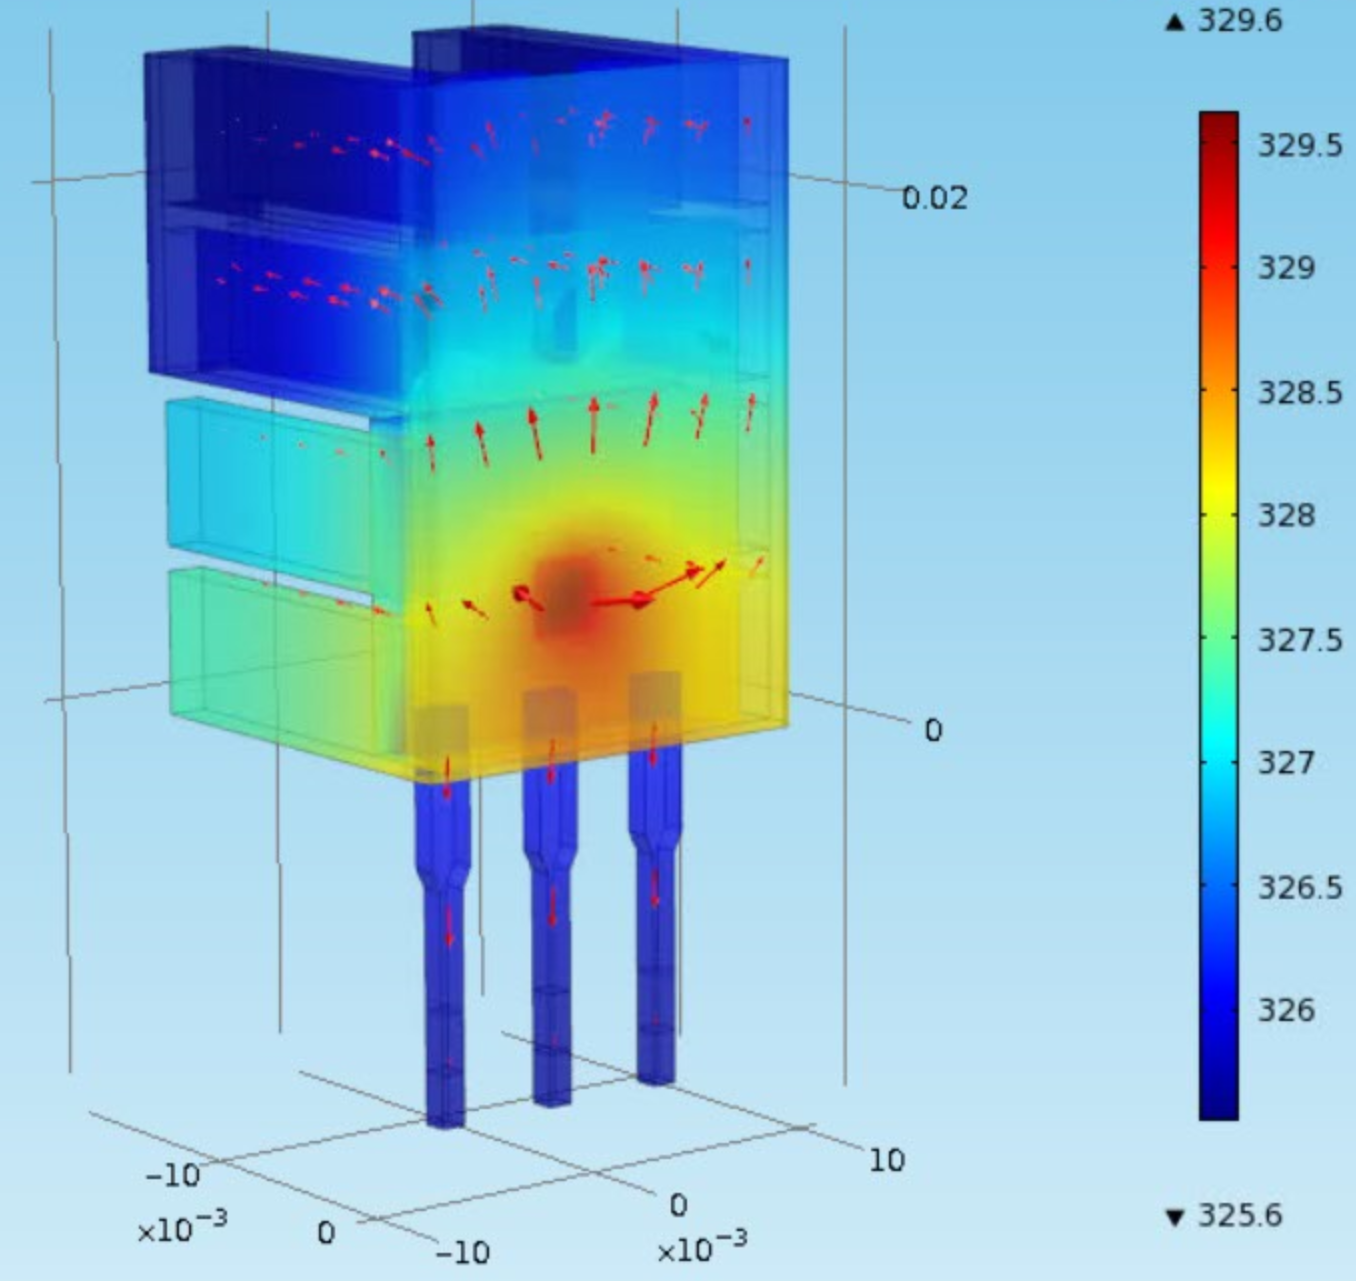
Heat is conducted from one sensor to the other through multiple layers of varying thermal conductivity as found in the heat sink, TIP31C transistor heater, TMP36 temperature sensor, as well as the gap between the two heat sinks (air, cardboard, plastic, metal, or something else). In addition, there are 3D aspects to the heaters that should be considered with a more rigorous analysis. A more detailed model would be required to accurately predict the resistance to conductive heat transfer without validating data.

| Parameter | Value |
|---|---|
| Ambient Temperature $(T_\infty)$ | 23.0 $^oC$ |
| Distance Between Sensors $(\Delta x)$ | 0.015 $m$ |
| Emissivity $(\epsilon)$ | 0.9 |
| Heat Capacity $(c_p)$ | 500 $\frac{J}{kg \, K}$ |
| Convective Heat Transfer Coefficient $(h)$ | 4.05 $\frac{W}{m^2 \, K}$ |
| Mass $(m)$ | 0.004 $kg$ |
| Stefan Boltzmann Constant $(\sigma)$ | 5.67x10$^{-8}$ $\frac{W}{m^2 \, K^4}$ |
| Surface Area $(A)$ | 1.0x10$^{-3}$ $m^2$ |
| Thermal Conductivity $(k)$ | Varies with Material |
An energy balance includes energy accumulation $m \, c_p \, \frac{dT}{dt}$, energy in, and energy out. The energy balance includes conduction from $T_1$ (+energy), convection to the ambient air (-energy), and radiative heat transfer (-energy). Use the following equations for an energy balance on $T_2$.
Conduction (Fourier's Law): $q_{cond} = -k \frac{dT}{dx} \approx -k_c \frac{T_2-T_1}{\Delta x}$
Convective Heat Transfer: $q_{conv} = h \, A \, \left(T_\infty-T_2\right)$
Radiative Heat Transfer: $q_{rad} = \sigma \, \epsilon \, A \, \left((T_\infty+273.15)^4-(T_2+273.15)^4\right)$
Energy Balance: $m \, c_p \, \frac{dT_2}{dt} = q_{cond} + q_{conv} + q_{rad}$
Composite Thermal Conductivity
Determine a composite heat transfer coefficient $k_c$ for each material test with the steady state data points. For steady state, assume that $\frac{dT_2}{dt}=0$. Solve the energy balance equation $0 = q_{conv}+q_{cond}+q_{rad}$ for $k_c$. Evaluate $k_c$ either through algebraic rearrangement or with an equation solver such as fsolve.
Create a semi-log x plot of the composite thermal conductivity $(k_c)$ versus $T_1$, $T_2$, and $\Delta T$ using an average of the last 6 data points for each of the plastic, metal, and cardboard tests. Use plt.semilogx to create the plot with thermal conductivity as the first argument and the temperatures as the second argument.
Solve Differential Equation
Use the composite thermal conductivity $k_c$ from the prior problem to solve the transient energy balance as an ordinary differential equation (ODE).
Conduction (Fourier's Law): $q_{cond} = -k \frac{dT}{dx} \approx -k_c \frac{T_2-T_1}{\Delta x}$
Convective Heat Transfer: $q_{conv} = h \, A \, \left(T_\infty-T_2\right)$
Radiative Heat Transfer: $q_{rad} = \sigma \, \epsilon \, A \, \left((T_\infty+273.15)^4-(T_2+273.15)^4\right)$
Energy Balance: $m \, c_p \, \frac{dT_2}{dt} = q_{cond} + q_{conv} + q_{rad}$
The initial condition is the initial temperature of $T_2$. Show the ODE solution for $T_2$ with data for each of the 3 cases (cardboard, plastic, and metal). Plot the measured temperatures and predicted temperatures for each case in a separate subplot. Add appropriate labels to the plot.