Regression Overview
Regression is a type of supervised learning that predicts continuous output values from a set of input features. The goal of regression is to build a model that can accurately predict the target variable for new, unseen data.


There are many different algorithms that can be used for regression, and some of the most commonly used ones include:
1️⃣ Linear Regression: Linear regression is a simple and widely used approach to regression that models the relationship between the input and output variables as a linear function. Linear regression is easy to interpret and computationally efficient, but it may not perform well for nonlinear relationships between variables.
2️⃣ k-Nearest Neighbors: k-Nearest Neighbors (k-NN) is a non-parametric algorithm that predicts the target value for a new data point by finding the k closest data points in the training set and averaging their target values. k-NN is simple and easy to implement, but it can be computationally expensive for large datasets.
3️⃣ Support Vector Regressor: Support Vector Regression (SVR) is a variant of support vector machines that can be used for regression problems. It works by finding the hyperplane that maximally separates the data points while minimizing the error on the training data.
4️⃣ Gaussian Processes: Gaussian Processes (GP) is a probabilistic approach to regression that models the relationship between the input and output variables as a Gaussian distribution. It is a flexible method that can be used to model complex, nonlinear relationships between variables, and can be used for both regression and classification problems.
5️⃣ Neural Network Regressor: Neural networks are a powerful class of models that can be used for regression and classification tasks. They are highly flexible and can model complex, nonlinear relationships between variables, but can be computationally expensive and require large amounts of training data.
6️⃣ XGBoost Regressor: XGBoost is a popular algorithm for regression and classification that uses a gradient boosting approach to iteratively improve the performance of the model. It is highly accurate and can handle large datasets with many features, but can be computationally expensive.
Other regression algorithms include decision trees, random forests, and Bayesian regression, among others. The choice of algorithm depends on the specific problem and the characteristics of the data, and it is often useful to try multiple algorithms and compare the performance.
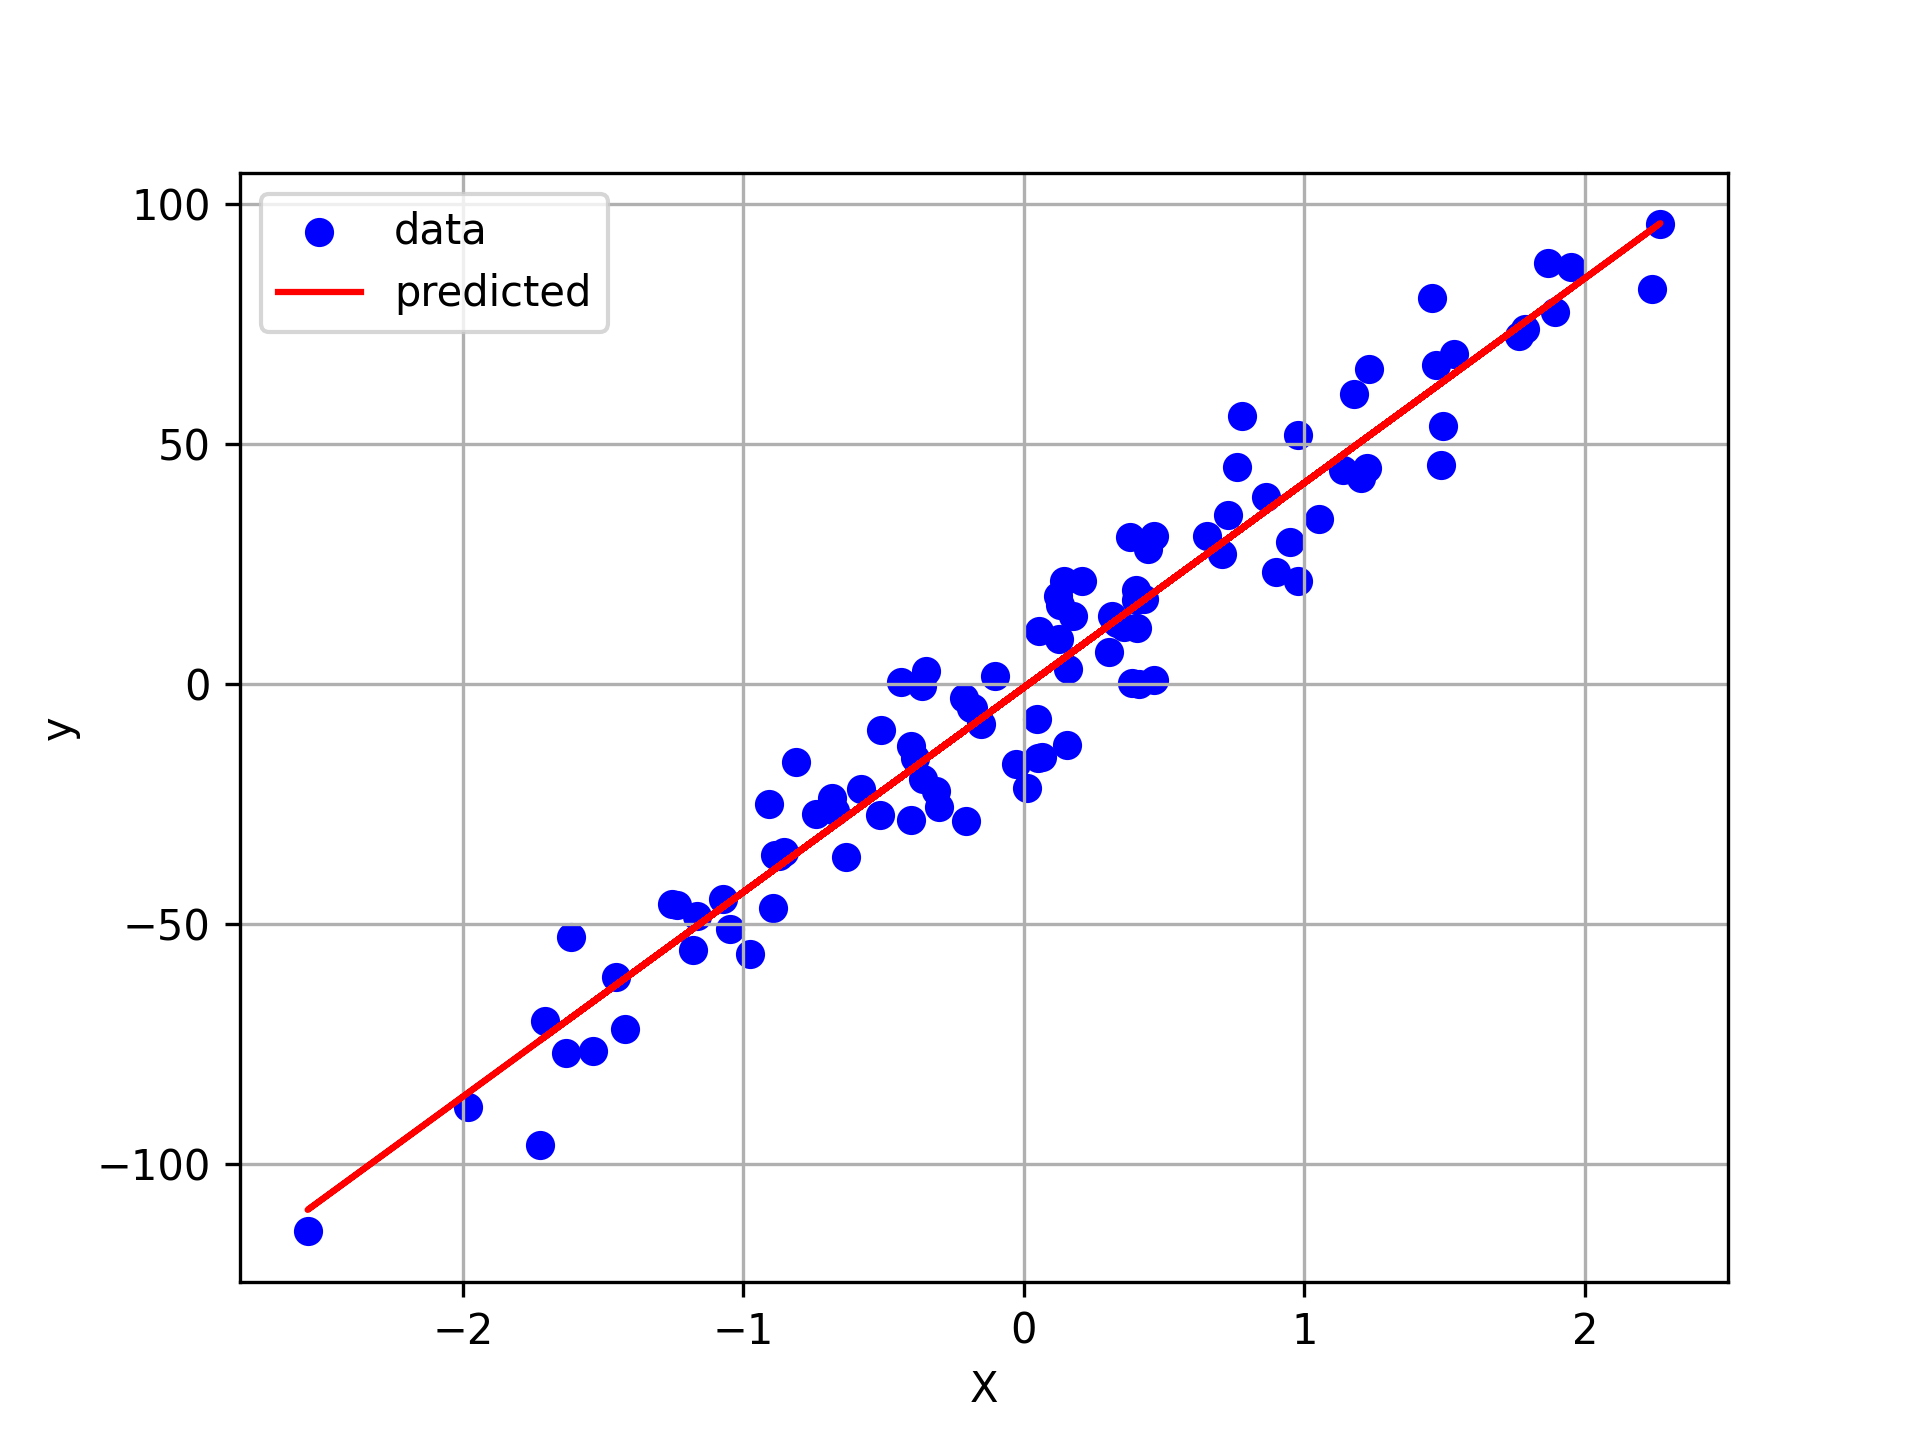
1D Regression Example
A linear regression has 100 sample points with one feature (X), one output label (y), and random variations in the data (noise). The scikit-learn.datasets method make_regression produces the sample data.
import matplotlib.pyplot as plt
from sklearn.datasets import make_regression
from sklearn.linear_model import LinearRegression
# Generate sample data
X, y = make_regression(n_samples=100, n_features=1, noise=10, random_state=0)
# Fit a linear regression model
model = LinearRegression()
model.fit(X, y)
# Plot the data and the fitted line
plt.scatter(X, y, color='blue', label='data')
plt.plot(X, model.predict(X), 'r-', label='predicted')
plt.xlabel('X'); plt.ylabel('y'); plt.legend()
plt.grid(); plt.savefig('linreg1D.png',dpi=300)
plt.show()
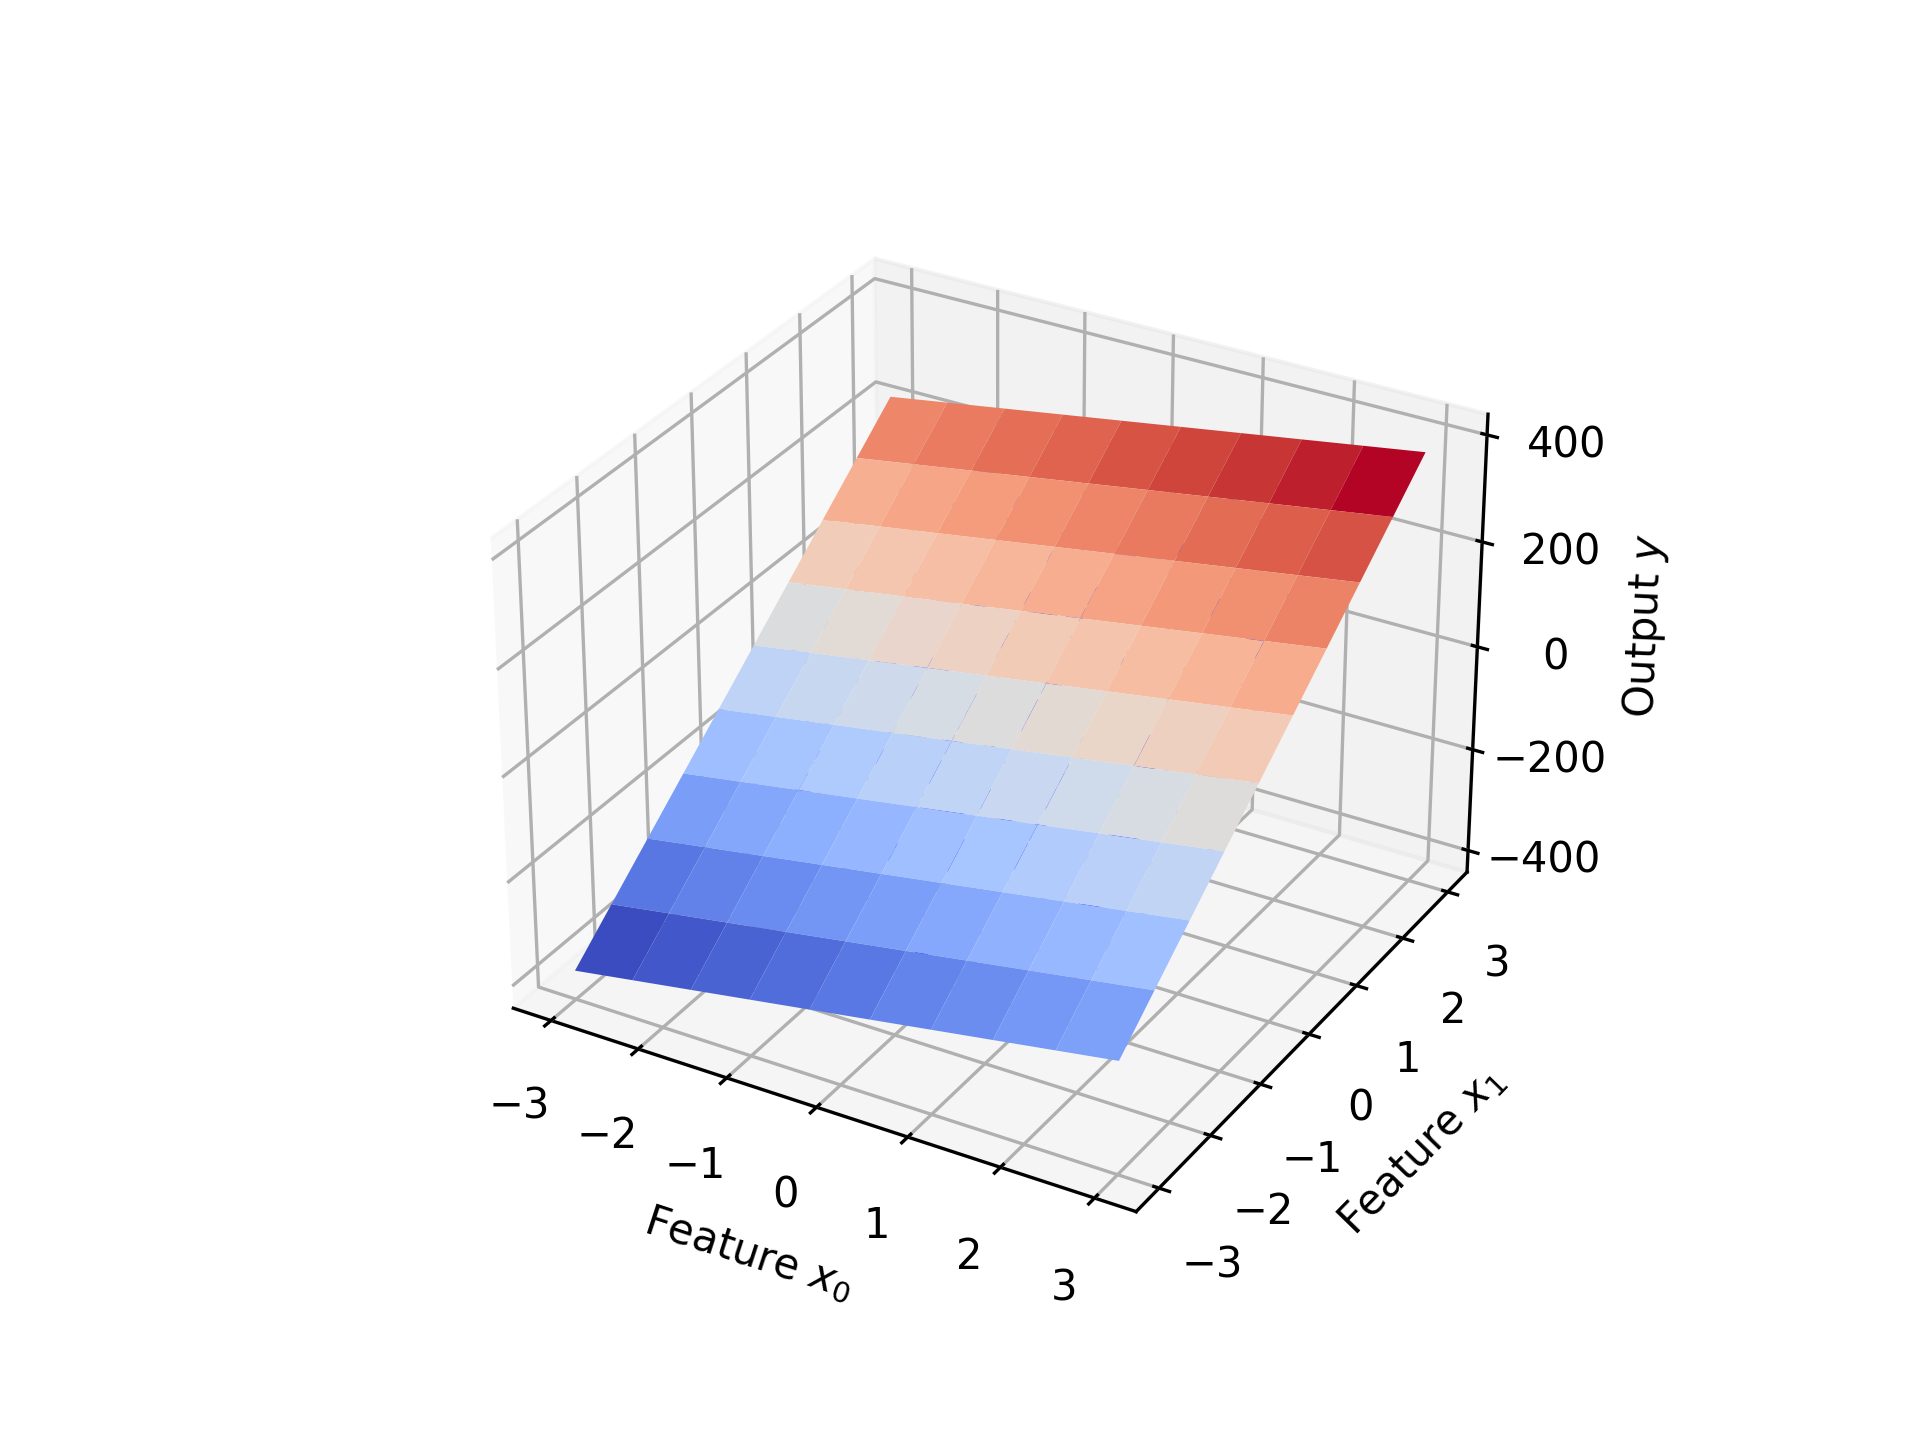
2D Regression Example
Another linear regression also has 100 sample points, but with two features (X). A 3-dimensional plot is used to view the relationship between the two features and the output.
import matplotlib.pyplot as plt
from sklearn.datasets import make_regression
from sklearn.linear_model import LinearRegression
# Generate sample data with 2 features
X, y = make_regression(n_samples=100, n_features=2, noise=50, random_state=0)
# Fit a linear regression model
model = LinearRegression()
model.fit(X, y)
# Plot the data and the fitted surface
fig = plt.figure()
ax = plt.axes(projection='3d')
ax.scatter(X[:, 0], X[:, 1], y, color='blue')
x0_surf, x1_surf = np.meshgrid(np.linspace(-3, 3, 10),
np.linspace(-3, 3, 10))
Xp = np.array([x0_surf.ravel(),x1_surf.ravel()]).T
y_surf = model.predict(Xp).reshape(x0_surf.shape)
ax.plot_surface(x0_surf, x1_surf, y_surf, cmap='coolwarm')
ax.set_xlabel(r'Feature $x_0$')
ax.set_ylabel(r'Feature $x_1$')
ax.set_zlabel(r'Output $y$')
plt.show()
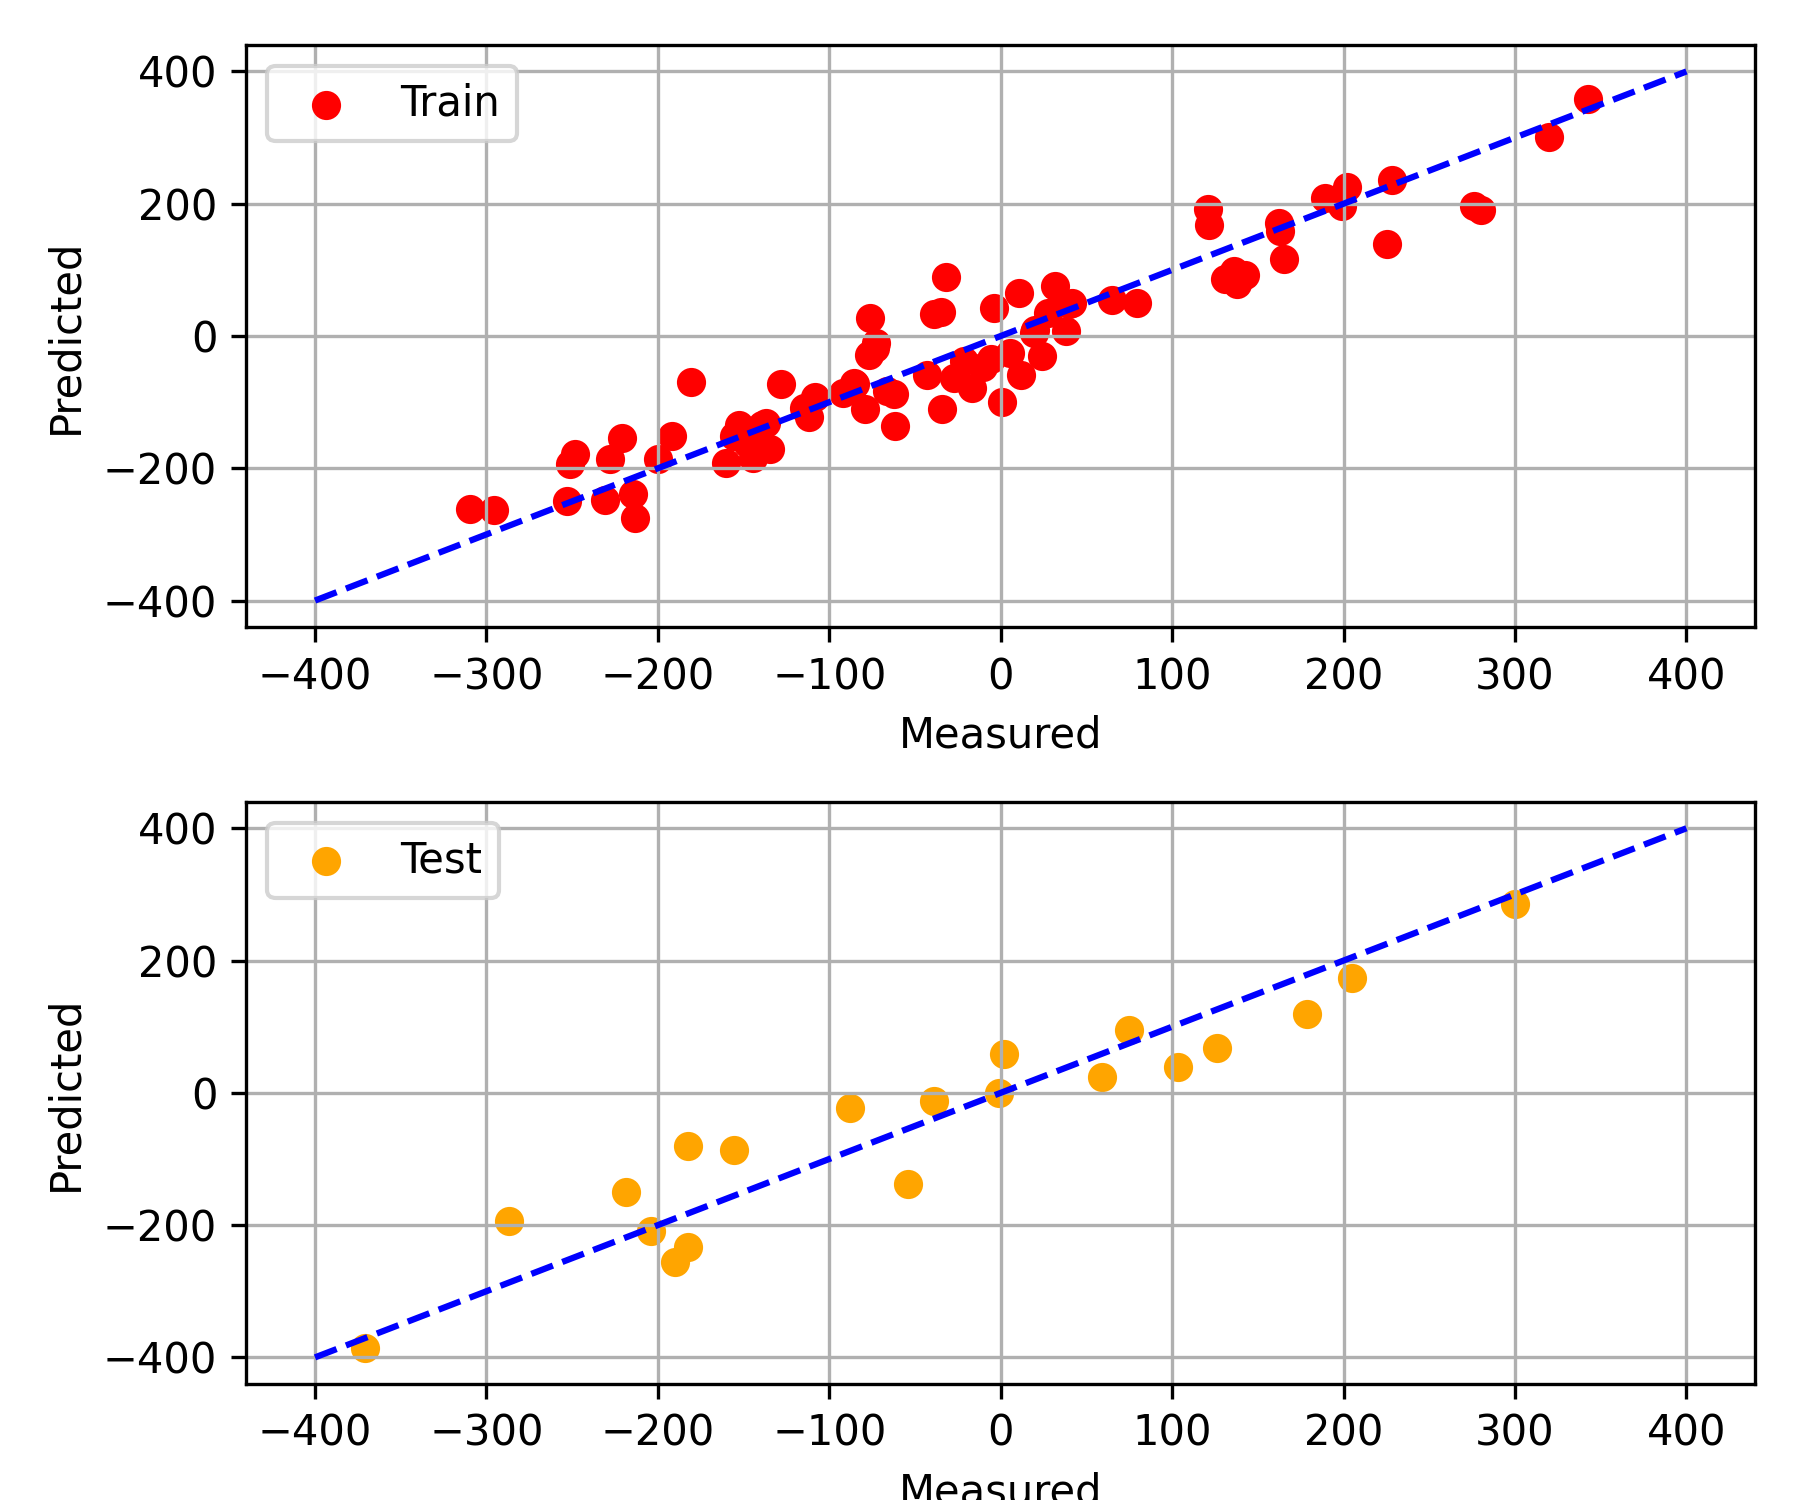
Multiple Regression
Regression results, especially with 3+ features, can be viewed with a parity plot to show the performance of the regression fit. Separate train (80%) and test sets (20%) are split to fit and evaluate the performance on separate data.
import matplotlib.pyplot as plt
from sklearn.datasets import make_regression
from sklearn.linear_model import LinearRegression
from sklearn.model_selection import train_test_split
# Generate some sample data with a linear relationship
X, y = make_regression(n_samples=100, n_features=5,
noise=50, random_state=0)
X_train, X_test, \
y_train, y_test = train_test_split(X, y,
test_size=0.2,
random_state=12)
# Fit a linear regression model to the data
model = LinearRegression()
model.fit(X_train, y_train)
# Plot the data and fit
plt.figure(figsize=(6,5))
plt.subplot(2,1,1)
plt.plot([-400,400],[-400,400],'b--')
yp = model.predict(X_train)
plt.scatter(y_train, yp, color='red',label='Train')
plt.grid(); plt.tight_layout(); plt.legend()
plt.xlabel('Measured'); plt.ylabel('Predicted')
plt.subplot(2,1,2)
plt.plot([-400,400],[-400,400],'b--')
yp = model.predict(X_test)
plt.scatter(y_test, yp, color='orange',label='Test')
plt.grid(); plt.tight_layout(); plt.legend()
plt.xlabel('Measured'); plt.ylabel('Predicted')
plt.savefig('parity.png',dpi=300)
plt.show()
Test Regressors
The lazypredict package tests many of the regression models in scikit-learn and returns a ranked list of the performance.
import matplotlib.pyplot as plt
from lazypredict.Supervised import LazyRegressor, REGRESSORS
from sklearn.preprocessing import StandardScaler
from sklearn.model_selection import train_test_split
from sklearn.datasets import make_regression
# Generate some sample data with a linear relationship
X, y = make_regression(n_samples=100, n_features=5,
noise=50, random_state=0)
y = y.reshape((-1, 1))
# scale data
s0 = StandardScaler(); s1 = StandardScaler()
Xs = s0.fit_transform(X); ys = s1.fit_transform(y)
# train / test split
Xs_train, Xs_test, \
ys_train, ys_test = train_test_split(Xs, ys,
test_size=0.2,
random_state=12)
# exclude regressors
reg_select = []
exclude = ['LGBMRegressor', 'GammaRegressor', 'PoissonRegressor']
for x in REGRESSORS:
if not any(x[0] == ex for ex in exclude):
reg_select.append(x[1])
# evaluate many regressors
reg = LazyRegressor(verbose=0, ignore_warnings=False, \
custom_metric=None, regressors=reg_select)
models, predictions = reg.fit(Xs_train, Xs_test, ys_train, ys_test)
# print results
print(models)
models.to_csv('results.csv')
| Model | Adjusted R-Squared | R-Squared | RMSE | Time Taken |
|---|---|---|---|---|
| TransformedTargetRegressor | 0.855 | 0.893 | 0.364 | 0.006 |
| LinearRegression | 0.855 | 0.893 | 0.364 | 0.006 |
| LassoLarsCV | 0.855 | 0.893 | 0.364 | 0.011 |
| LassoLarsIC | 0.855 | 0.893 | 0.364 | 0.008 |
| LarsCV | 0.855 | 0.893 | 0.364 | 0.013 |
| Lars | 0.855 | 0.893 | 0.364 | 0.007 |
| BayesianRidge | 0.854 | 0.893 | 0.364 | 0.006 |
| Ridge | 0.854 | 0.892 | 0.365 | 0.005 |
| RidgeCV | 0.854 | 0.892 | 0.365 | 0.005 |
| KernelRidge | 0.853 | 0.892 | 0.366 | 0.006 |
| LassoCV | 0.853 | 0.891 | 0.366 | 0.056 |
| ElasticNetCV | 0.853 | 0.891 | 0.367 | 0.047 |
| SGDRegressor | 0.852 | 0.891 | 0.367 | 0.005 |
| LinearSVR | 0.85 | 0.889 | 0.37 | 0.005 |
| OrthogonalMatchingPursuitCV | 0.847 | 0.887 | 0.373 | 0.008 |
| HuberRegressor | 0.843 | 0.885 | 0.378 | 0.009 |
| RANSACRegressor | 0.832 | 0.876 | 0.392 | 0.016 |
| MLPRegressor | 0.804 | 0.855 | 0.423 | 0.053 |
| GradientBoostingRegressor | 0.638 | 0.733 | 0.574 | 0.049 |
| ExtraTreesRegressor | 0.622 | 0.722 | 0.587 | 0.089 |
| KNeighborsRegressor | 0.621 | 0.721 | 0.588 | 0.007 |
| SVR | 0.596 | 0.703 | 0.606 | 0.006 |
| PassiveAggressiveRegressor | 0.585 | 0.694 | 0.615 | 0.006 |
| NuSVR | 0.578 | 0.689 | 0.62 | 0.005 |
| LGBMRegressor | 0.54 | 0.661 | 0.648 | 0.02 |
| XGBRegressor | 0.538 | 0.66 | 0.649 | 0.05 |
| RandomForestRegressor | 0.533 | 0.656 | 0.652 | 0.123 |
| TweedieRegressor | 0.506 | 0.636 | 0.671 | 0.006 |
| AdaBoostRegressor | 0.506 | 0.636 | 0.671 | 0.058 |
| HistGradientBoostingRegressor | 0.476 | 0.614 | 0.691 | 0.058 |
| BaggingRegressor | 0.47 | 0.61 | 0.695 | 0.019 |
| DecisionTreeRegressor | 0.333 | 0.509 | 0.78 | 0.005 |
| GaussianProcessRegressor | 0.294 | 0.48 | 0.802 | 0.008 |
| OrthogonalMatchingPursuit | 0.032 | 0.286 | 0.939 | 0.005 |
| ExtraTreeRegressor | -0.008 | 0.258 | 0.958 | 0.005 |
| ElasticNet | -0.153 | 0.15 | 1.025 | 0.006 |
| QuantileRegressor | -0.365 | -0.006 | 1.115 | 0.076 |
| LassoLars | -0.387 | -0.022 | 1.125 | 0.005 |
| Lasso | -0.387 | -0.022 | 1.125 | 0.007 |
| DummyRegressor | -0.387 | -0.022 | 1.125 | 0.005 |