Battery Life Prediction🔋
The Hawaii Natural Energy Institute conducted an analysis on 14 NMC-LCO 18650 batteries, each with a nominal capacity of 2.8 Ah. These batteries underwent over 1000 charge-discharge cycles at a temperature of 25°C, using a constant current-constant voltage (CC-CV) charging method at a C/2 rate and a discharge rate of 1.5C.


Objective: Develop a predictive model for the remaining battery life of the batteries based on several features such as discharge time, voltage, charging time, etc.
Data:

The data includes measurements from charging and discharging 14 batteries until the remaining useful life is reached.
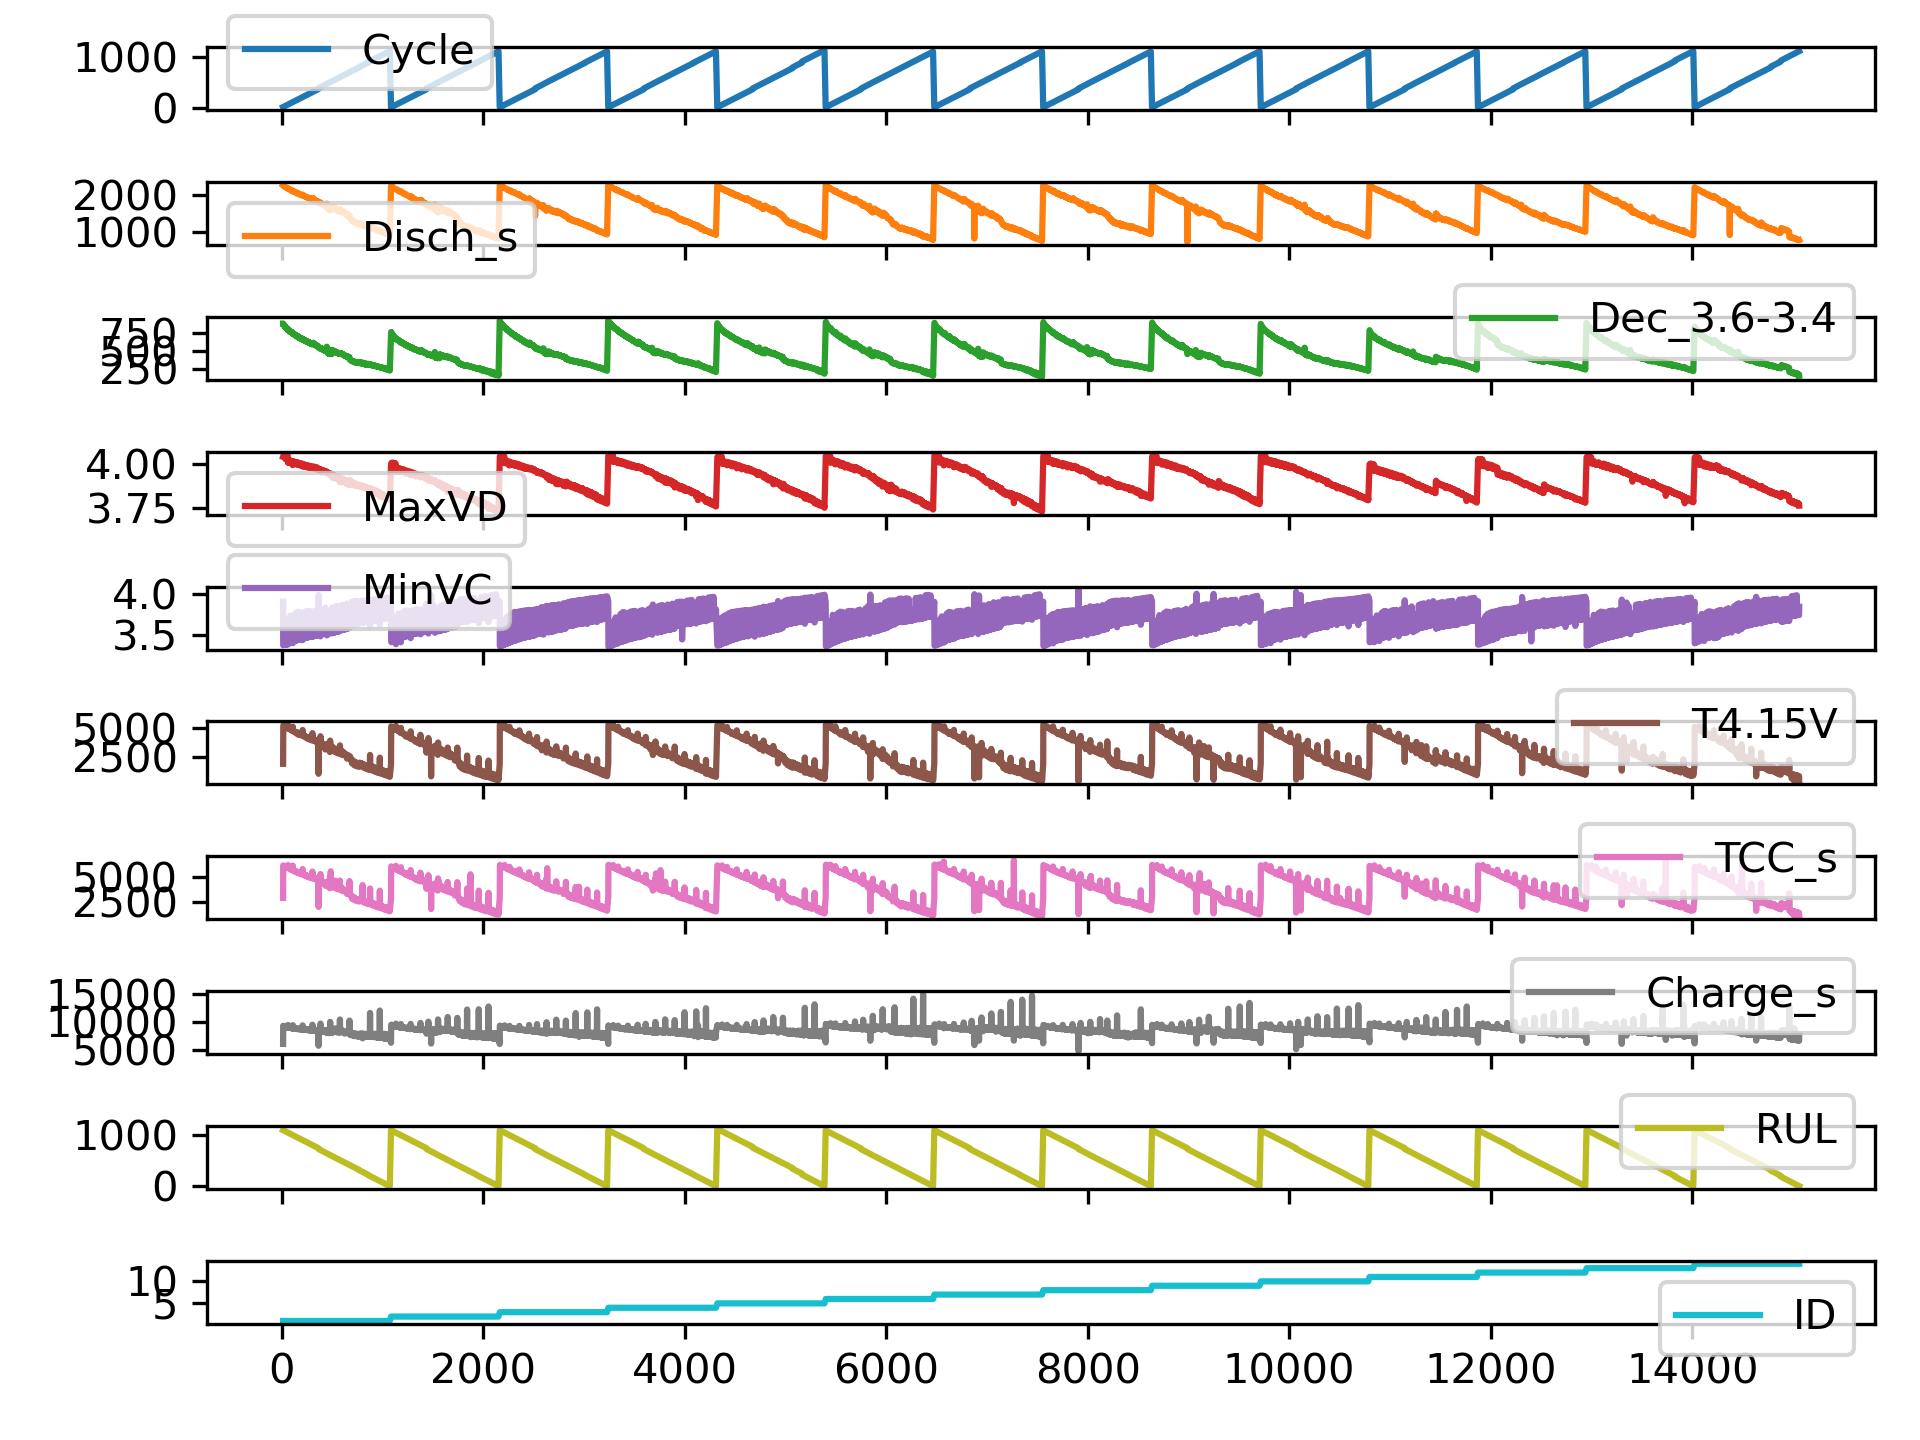
- Cycle Index: number of cycle
- F1: Discharge Time (s)
- F2: Time at 4.15V (s)
- F3: Time Constant Current (s)
- F4: Decrement 3.6-3.4V (s)
- F5: Max. Voltage Discharge (V)
- F6: Min. Voltage Charge (V)
- F7: Charging Time (s)
- Total time (s)
The cycle count is recorded for each charge/discharge cycle. When the battery reaches a predefined lower charge capacity, the remaining useful life is set to zero and preceding cycles are recorded as 1, 2, 3...as the target variable RUL (Remaining Useful Life).
- RUL: target
Methods:
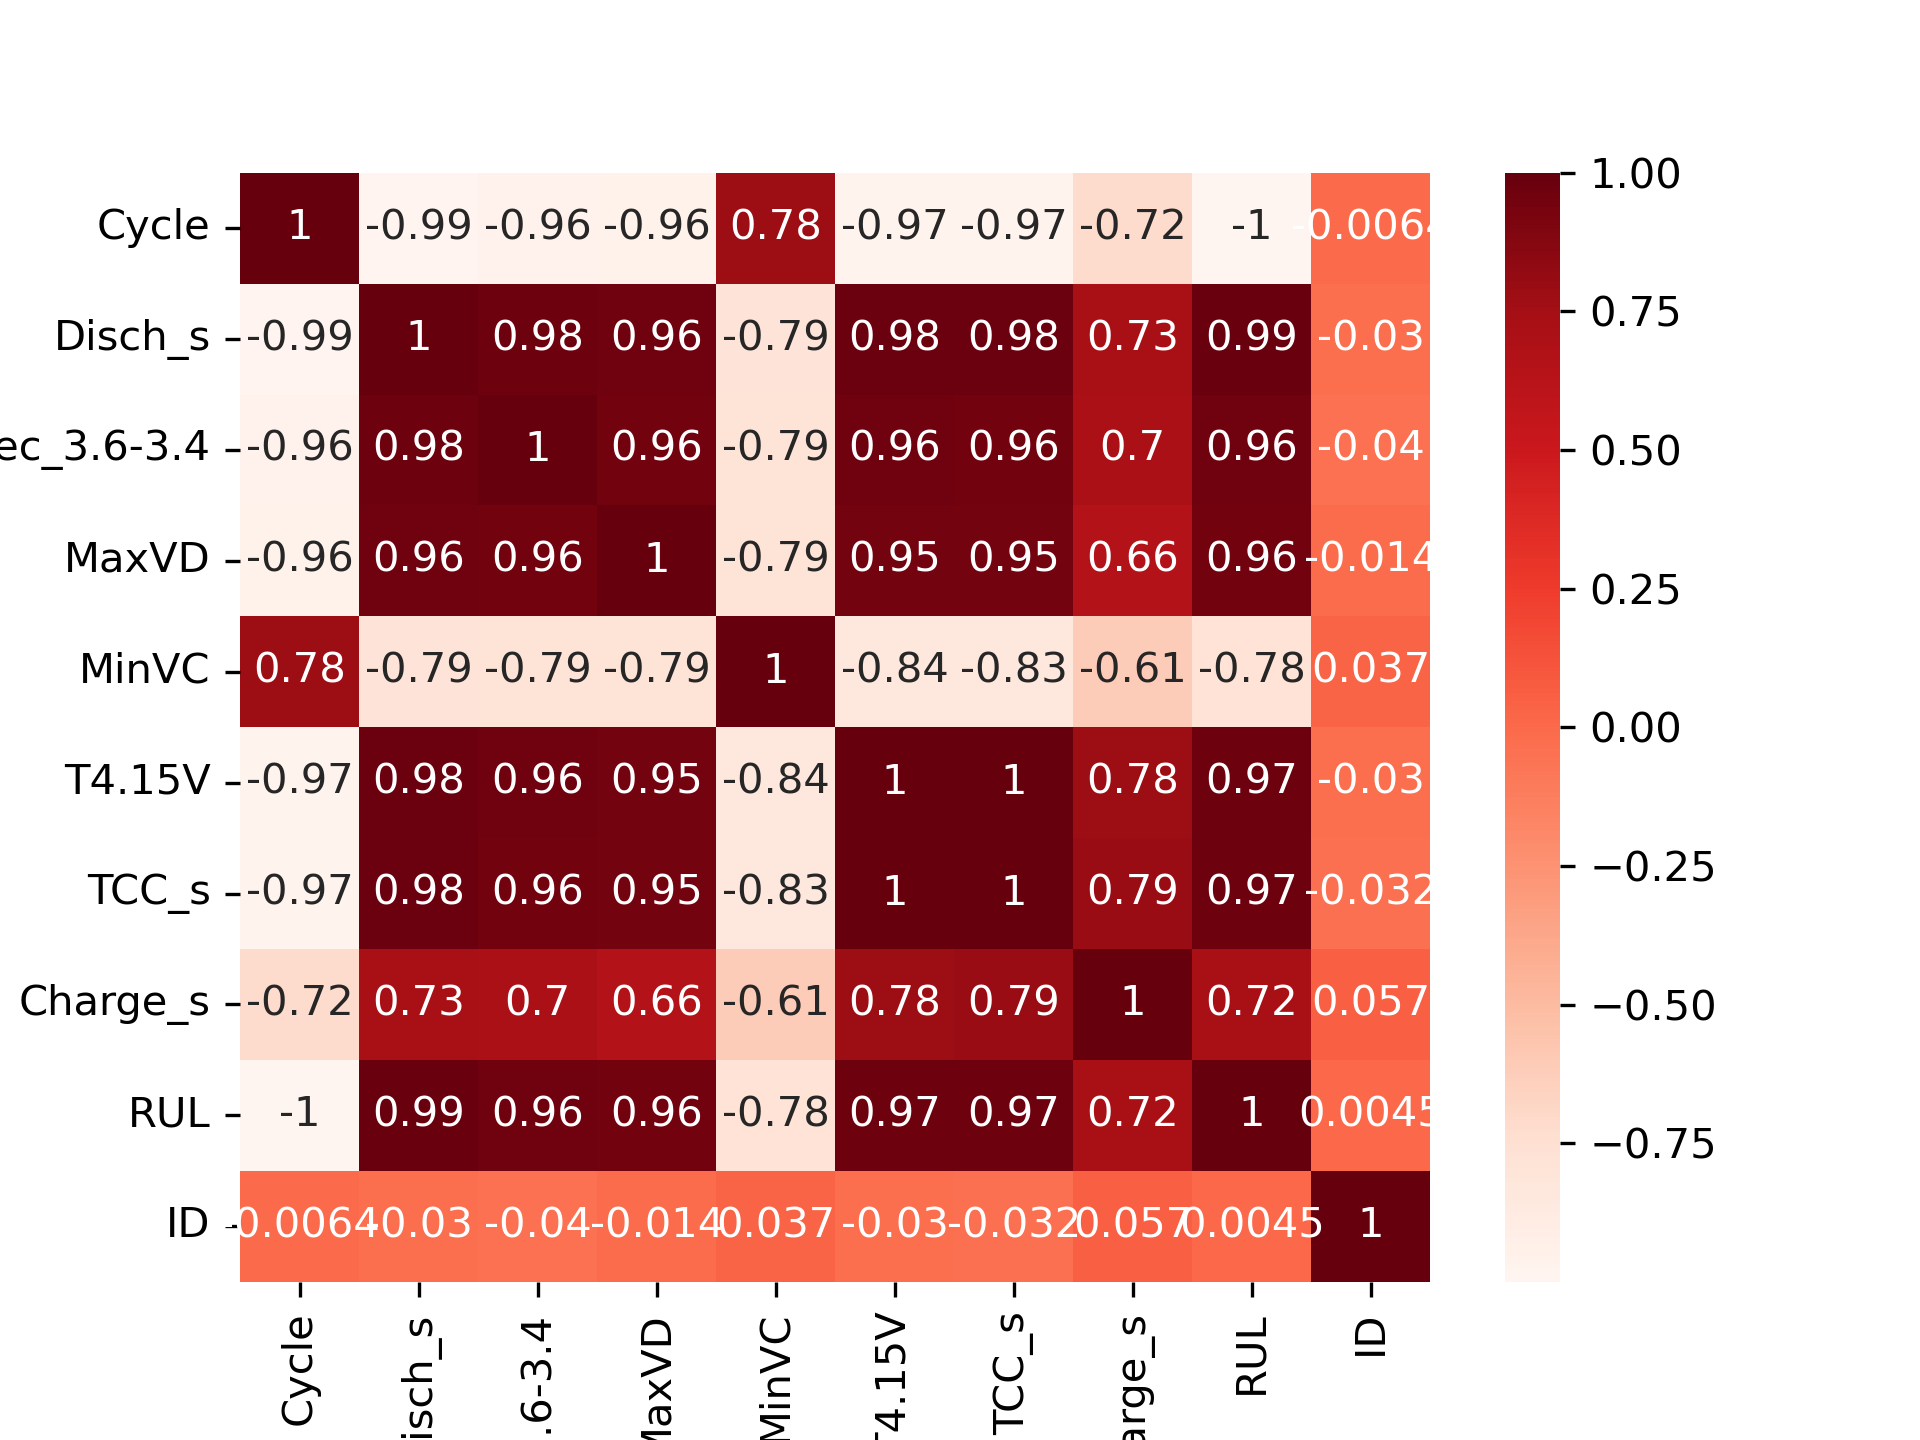
- Data cleansing, visualization (e.g., pair plots, joint plots), and exploration.
- Application of multiple regression methods including Linear Regression, Multiple Linear Regression, PyTorch, and TensorFlow models.
- Splitting data into training and testing sets.
- Regression comparison
- View Remaining Useful Life prediction versus measured values
References
- Battery Remaining Useful Life on Kaggle, Updated: June 15, 2022.
Solution

| Model | Adjusted R-Squared | R-Squared | RMSE | Time Taken |
|---|---|---|---|---|
| KernelRidge | 0.96 | 0.96 | 0.20 | 7.81 |
| ElasticNetCV | 0.96 | 0.96 | 0.20 | 0.16 |
| RidgeCV | 0.96 | 0.96 | 0.20 | 0.01 |
| Ridge | 0.96 | 0.96 | 0.20 | 0.01 |
| BayesianRidge | 0.96 | 0.96 | 0.20 | 0.01 |
| TransformedTargetRegressor | 0.96 | 0.96 | 0.20 | 0.01 |
| LinearRegression | 0.96 | 0.96 | 0.20 | 0.01 |
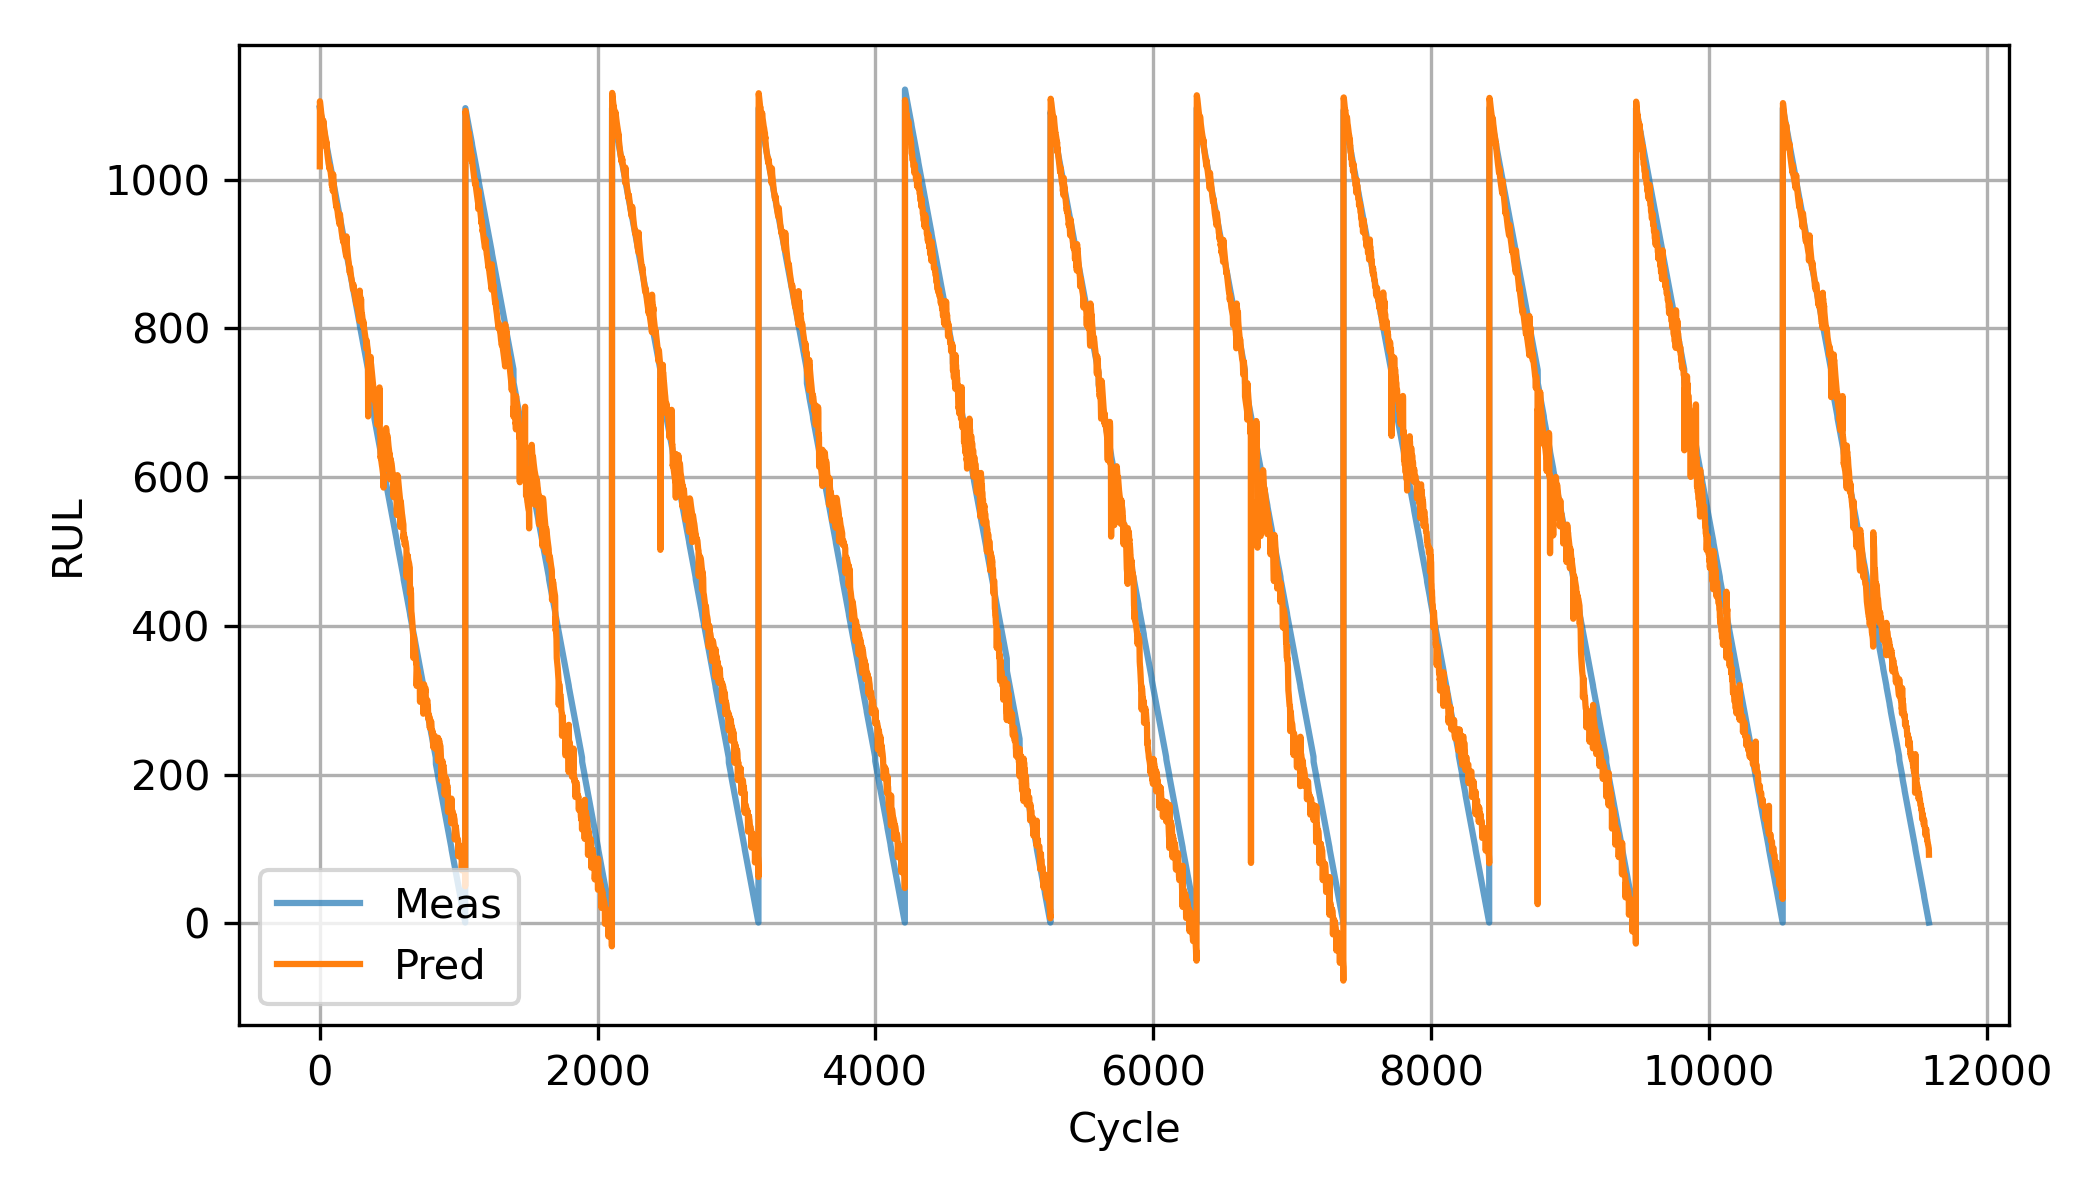
Training Results (11 Batteries)
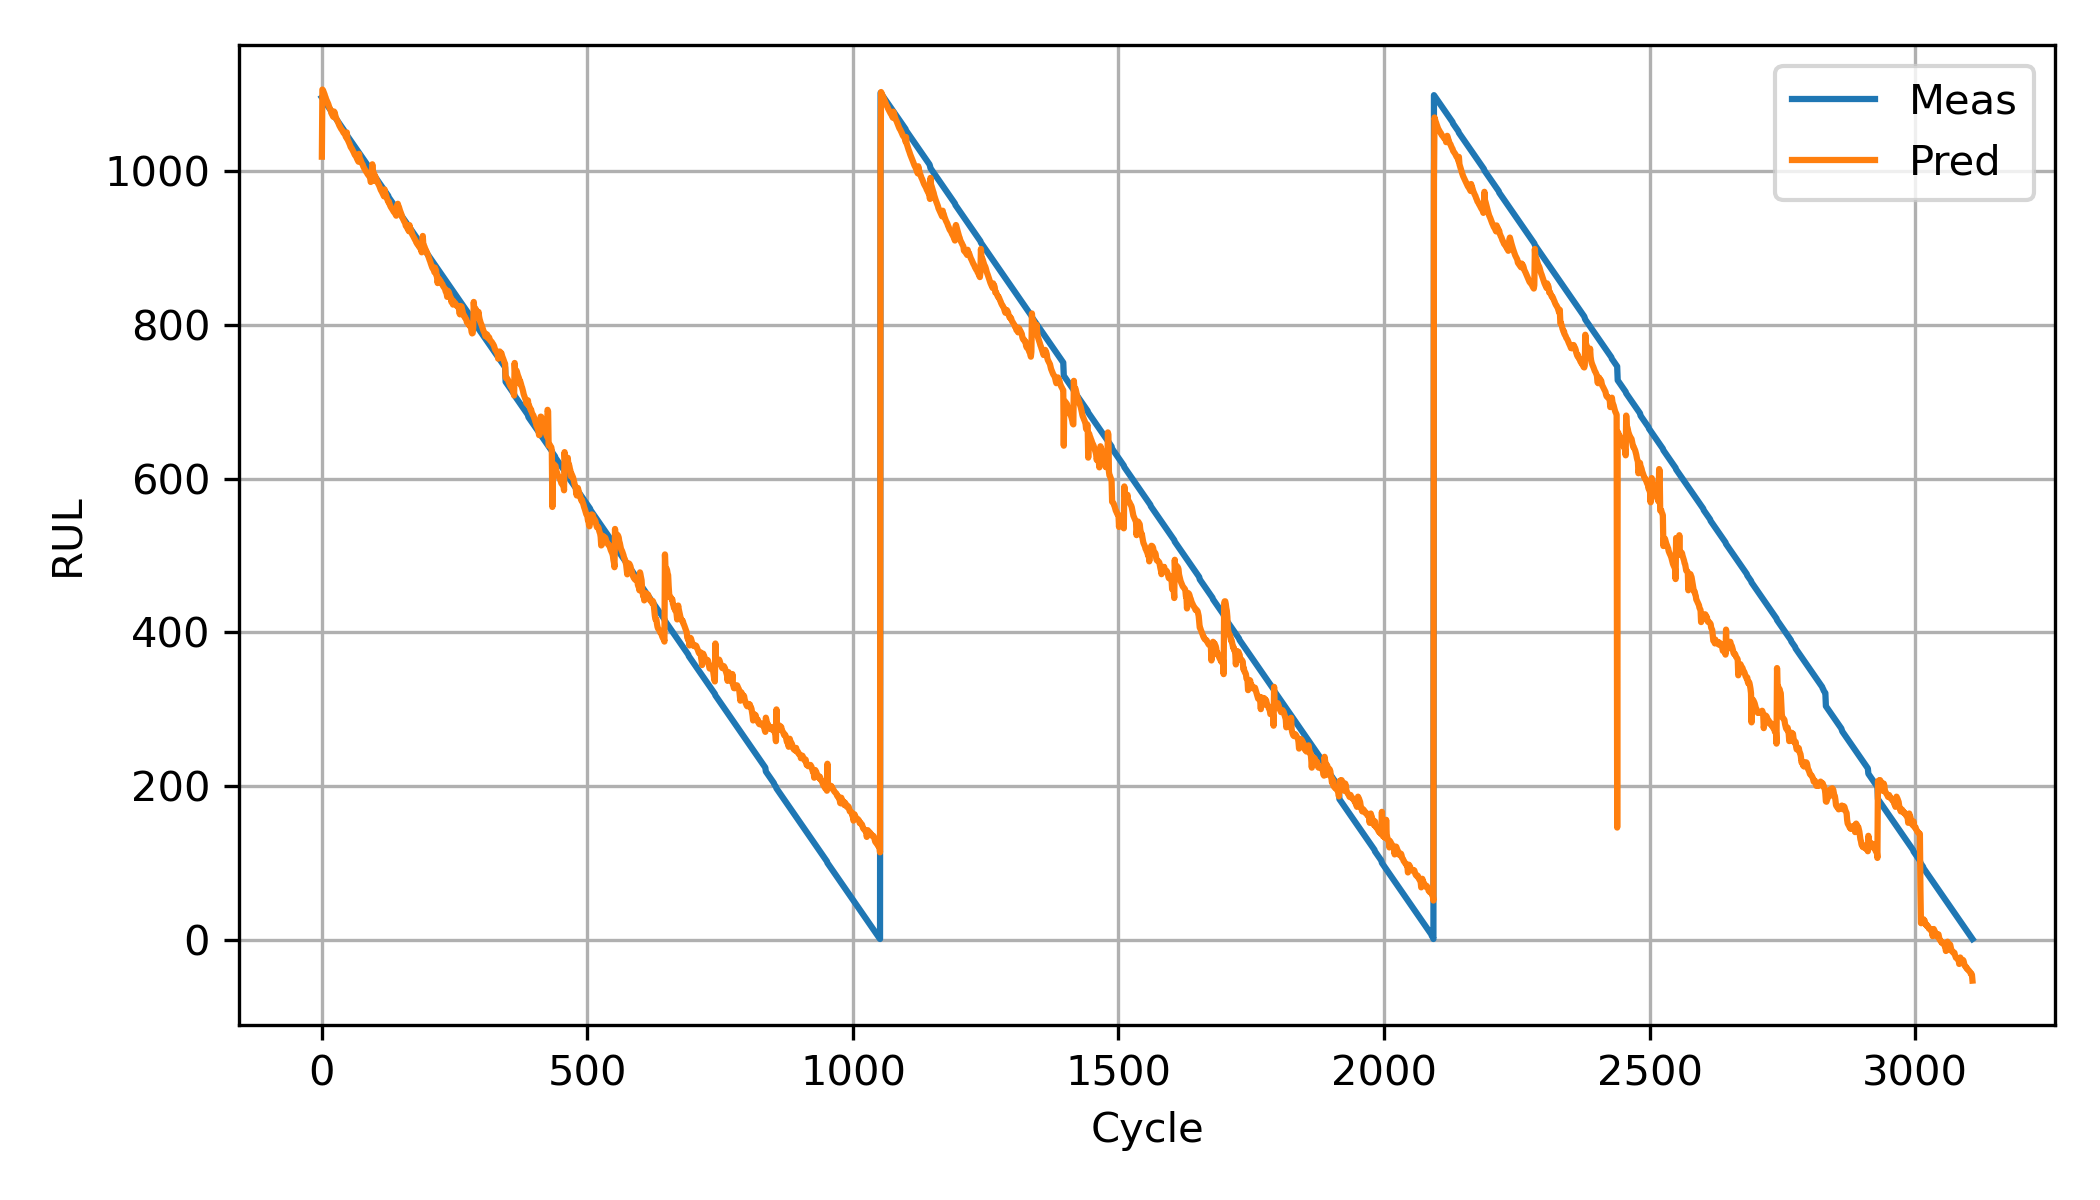
Test Results (3 Batteries)