Power Generation for Engineers
⚡ Power Drives Prosperity
Electric power production is the foundation of modern civilization, directly tied to prosperity and economic growth, with energy use strongly correlated to Gross Domestic Product. This importance is magnified by the explosive rise of data centers, particularly those powering artificial intelligence, with electricity demand that is doubling approximately every six months. Meeting this demand requires not only increasing generation capacity but also ensuring system reliability, efficiency, and sustainability. Engineers are at the forefront of this challenge: designing advanced power systems, integrating renewable and conventional energy sources, expanding transmission infrastructure, and building the physical plants that supply the world with electricity. This work is important for industrial and residential needs, but also for the digital infrastructure that now drives global innovation.
Power Generation and Distribution
Electric power generation converts primary energy sources (chemical, nuclear or renewable) into electricity. Most utility‑scale plants use fuel to create steam or hot gases that drive turbines coupled to synchronous generators. Mechanical rotation inside the generator induces alternating current (AC) according to Faraday’s law. To minimize line losses, electricity is stepped up to high voltages (hundreds of kilovolts) for transmission over long distances. High‑voltage AC is standard because transformers easily change voltage levels, but high‑voltage direct‑current (HVDC) lines are used for very long distances and to interconnect unsynchronised grids. HVDC lines transmit large amounts of power more efficiently because there is no reactive power and lower line charging current.
After transmission, the voltage is stepped down through substations and distribution transformers before reaching industrial loads or data centers. The U.S. produced about 4.18 trillion kWh of electricity in 2023. The electricity was generate with ~60% from fossil fuels, ~19% from nuclear and ~21% from renewables.
Calculating Power and Energy ⚙️
Electrical power is measured in watts (W) and energy in watt‑hours (Wh). A gigawatt (GW) is one billion watts. The energy generated by a plant of power P over time t is:
$$E = P \times t$$
with E in watt‑hours when P is watts and t is hours. For example, a 2 GW plant operating continuously for 24 h produces:
$$E = 2\text{GW} \times 24\text{h} = 48\text{GWh}$$
Over a 30‑day month, the same plant produces `2 \text{GW} \times 720 \text{h} = 1.44\text{TWh}`.
Essential Equations: DC and AC Power with V, I, and R
Ohm’s Law (all systems)
Ohm’s Law is the foundation of all circuit analysis, linking voltage, current, and resistance. It is used everywhere from household electronics to high-voltage power grids to understand how current flows and how components interact. Without this relationship, engineers cannot size conductors, design circuits, or predict performance.
$$V = I \times R$$
🔢 Sample calculation: If `I = 5 A` flows through a resistor `R = 10 Ω`, then V = 5 x 10 = 50 V
DC Circuit Power (steady voltage and current)
DC power calculations are crucial for systems with constant voltage sources such as batteries, solar panels, and industrial DC motors. These equations determine how much power a device consumes or delivers and how much energy is stored or required over time. Engineers rely on them when designing renewable energy systems, automotive electronics, and backup power supplies.
$$P = V I = I^2 R = \dfrac{V^2}{R}$$
🔢 Sample calculation: For `V = 12 V` across a `6 Ω` resistor,
$$P = \dfrac{V^2}{R} = \dfrac{12^2}{6} = 24\text{W}$$
Energy over time
$$E = P t$$
🔢 Sample calculation: If `P = 24 W` runs for `3 h`,
$$E = 24 \times 3 = 72\text{Wh}$$
AC Circuits (sinusoidal, RMS values)
Most large-scale power systems operate on alternating current (AC), making AC power equations essential for electrical engineering practice. The key quantities are:
- P = real power (Watts), the useful work performed.
- Q = reactive power (vars), associated with energy storage in inductors/capacitors.
- S = apparent power (volt-amps), the product of RMS voltage and current.
- pf = power factor, ratio of real to apparent power.
- `\varphi` = phase angle between voltage and current.
Real, reactive, and apparent power help describe not only the useful power delivered to loads but also the inefficiencies introduced by phase shifts `S - P`. The inefficiency is the extra apparent power that must be supplied because of reactive effects (inductance/capacitance), even though only `P` is doing real work. This knowledge is critical for power distribution networks, industrial machines, and any system with motors, transformers, or inductive components.
$$P = V_\mathrm{rms} I_\mathrm{rms} \cos\varphi$$ $$Q = V_\mathrm{rms} I_\mathrm{rms} \sin\varphi$$ $$S = V_\mathrm{rms} I_\mathrm{rms} = \sqrt{P^2 + Q^2}$$ $$\mathrm{pf} = \dfrac{P}{S} = \cos\varphi$$
🔢 Sample calculation:
$$V_\mathrm{rms} = 120 V \quad I_\mathrm{rms} = 10 A \quad \varphi = 30°$$
$$P = 120 \times 10 \times \cos 30° = 1200 \times 0.866 \approx 1040\text{W}$$
Three-Phase Systems (balanced)
Three-phase power is the backbone of industrial and utility-scale power delivery. The same definitions apply: P (real power), Q (reactive power), S (apparent power), pf (power factor), and `\varphi` (phase angle). In these systems, `V_{LL}` is the line-to-line voltage (measured between two phase conductors), while `V_{\phi}` is the phase voltage (measured from a phase conductor to neutral). In a wye (Y) connection, `V_{\phi} = V_{LL}/\sqrt{3}`, whereas in a delta (Δ) connection, `V_\phi = V_{LL}`. These relationships are critical for correctly applying three-phase power formulas, sizing equipment, and ensuring efficiency in power plants, factories, and data centers.
$$P = \sqrt{3}\, V_{LL} I_L \cos\varphi$$ $$Q = \sqrt{3}\, V_{LL} I_L \sin\varphi$$ $$S = \sqrt{3}\, V_{LL} I_L$$
🔢 Sample calculation: For `V_{LL} = 480 V`, `I_L = 50 A`, and `\varphi = 20°`, $$P = \sqrt{3} \times 480 \times 50 \times \cos 20° \approx 41.6\text{kW}$$
Line Losses and Voltage Drop
Whenever current flows through conductors, some energy is lost as heat. Line loss and voltage drop calculations are vital for efficient system design, ensuring that transmission and distribution lines deliver power reliably. Engineers use these equations to decide conductor sizes, limit wasted energy, and maintain voltage stability in everything from small circuits to cross-country transmission lines.
Resistive losses $$P_\text{loss} = I^2 R_\text{line}$$
🔢 Sample calculation: If `I = 200 A` flows through `R_\text{line} = 0.1 Ω`, $$P_\text{loss} = 200^2 \times 0.1 = 4000\text{W}$$
Voltage drop (approximate for resistive line) $$\Delta V \approx I R_\text{line}$$
🔢 Sample calculation: For `I = 200 A` and `R_\text{line} = 0.1 Ω`, $$\Delta V = 200 \times 0.1 = 20\text{V}$$
Power Factor Correction
A poor power factor increases losses and raises costs because utilities must supply more current for the same amount of real power. Power factor correction calculations help engineers design capacitor banks and other compensation methods to improve efficiency. This is especially important in industries with heavy motor loads, where small improvements in power factor can save millions in energy bills and reduce grid strain. Capacitor reactive power is measured in var (volt-ampere reactive).
$$Q_c = P\left(\tan\varphi_1 - \tan\varphi_2\right)$$
🔢 Sample calculation: A 100 kW load has `\varphi_1 = 30°` and is corrected to `\varphi_2 = 10°`. $$Q_c = 100,000 \times (\tan 30° - \tan 10°) \approx 100,000 \times (0.577 - 0.176) = 40,100\text{var}$$
Example: Two Data Centers Powered by a 2 GW Plant 🖥️
Assume a 2 GW power plant supplies two identical data centers, each receiving 1 GW. The energy consumed by each data center over a 30‑day month is:
$$E_\mathrm{dc} = 1\,\text{GW} \times 720\,\text{h} = 720\,\text{GWh} = 7.2\times 10^8\,\text{kWh}$$
The monthly peak demand is 1 GW (1 000 000 kW).
Billing Example 🔢
Utilities typically bill large customers using:
- Demand (power) charges: highest 15‑min demand during on‑peak periods.
- Energy charges: price per kWh consumed, often different for on‑peak and off‑peak hours.
- Fixed charges: customer service and facility charges.
Rocky Mountain Power (Utah)
The Utah Public Service Commission’s Schedule 8 (effective 25 April 2025) applies to customers with loads ≥ 1000 kW. Key charges are:
| Charge type | Typical rate (summer) | Notes |
|---|---|---|
| Customer service | $73 per month | per customer |
| Facilities charge | $4.95 per kW | applied to the measured kW demand |
| On-peak power charge | $16.18 per kW (Jun – Sep) $14.32 per kW (Oct – May) |
charged on maximum 15-min on-peak demand |
| Energy charge – on-peak | 5.9963 ¢/kWh (Jun – Sep) 5.3064 ¢/kWh (Oct – May) |
per kWh used during on-peak hours |
| Energy charge – off-peak | 3.0478 ¢/kWh (Jun – Sep) 2.6972 ¢/kWh (Oct – May) |
per kWh used during off-peak hours |
Example calculation: Suppose the data center peak demand is 1000 MW and on‑peak energy is 30% of total use. During summer months:
- Demand charges: 1,000,000 kW × $16.18/kW ≈ $16.18 M
- Facilities charges: 1,000,000 kW × $4.95/kW = $4.95 M
- Energy charges: on‑peak 30 % of 720 GWh × 5.9963¢/kWh + off‑peak 70 % × 3.0478¢/kWh ≈ $28.3 M
The total monthly bill is roughly $49 M. Actual bills include additional adjustments (power‑factor penalties, surcharges, etc.), but this illustrates how demand and energy charges dominate.
ERCOT / Texas (Oncor)
Texas operates a deregulated market. Retail energy providers sell electricity at a flat energy rate, and the Transmission and Distribution Utility (TDU) charges for delivery. For the Oncor area, distribution charges in August 2025 are $0.038447 per kWh. Many retail plans advertise energy rates around 9 ¢/kWh for businesses. These delivery charges are added to the energy price.
Example calculation: For the 1 GW data center consuming 720 GWh in a month:
- Energy cost: 720 million kWh × $0.09/kWh = $64.8 M.
- Delivery cost: 720 million kWh × $0.038447/kWh = $27.7 M.
The total monthly bill is about $92.5 M. ERCOT typically does not levy separate demand charges in retail contracts, so the bill is dominated by energy and delivery rates. The example highlights how regulated utilities (like Rocky Mountain Power) combine large demand charges with lower energy rates, while deregulated markets (ERCOT) rely more on per‑kWh pricing plus delivery charges.
Power Generation Sources in the U.S. 🌍
- Natural gas plants burn methane to produce high‑pressure steam or drive turbines directly. They offer fast ramp‑up and currently dominate U.S. generation (~43 % in 2023).
- Coal plants combust coal to make steam; their share has fallen from ~45 % in 2010 to ~16 % by 2023 as cleaner sources and regulations have reduced coal usage.
- Nuclear power uses fission in pressurized reactors to generate steam; it provided about 18.6 % of U.S. electricity in 2023 and offers high capacity factors but faces high capital costs and waste‑management challenges.
- Hydroelectric power captures energy from flowing water and contributed about 5.7 % in 2023 with output that varies with rainfall and snowpack.
- Wind turbines convert kinetic energy from wind into electricity. Wind generation grew 2.4‑fold over the last decade and provided 10.2 % of U.S. electricity in 2023.
- Solar photovoltaic and thermal plants convert sunlight into electrical energy; solar generation grew 7.8‑fold from 2015 to 2024. Together, solar and wind supplied 17 % of U.S. electricity in 2024.
Each source has unique advantages and limitations (availability of fuel, emissions, cost, and intermittency). A diversified generation portfolio improves grid reliability and reduces environmental impacts.
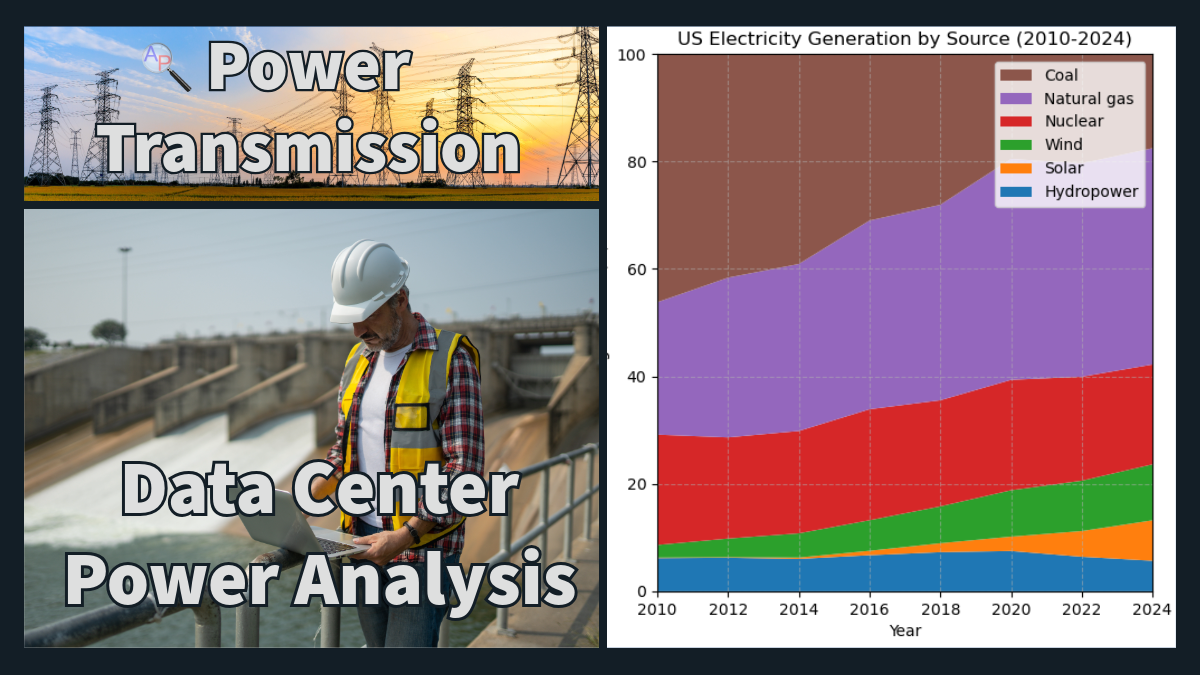
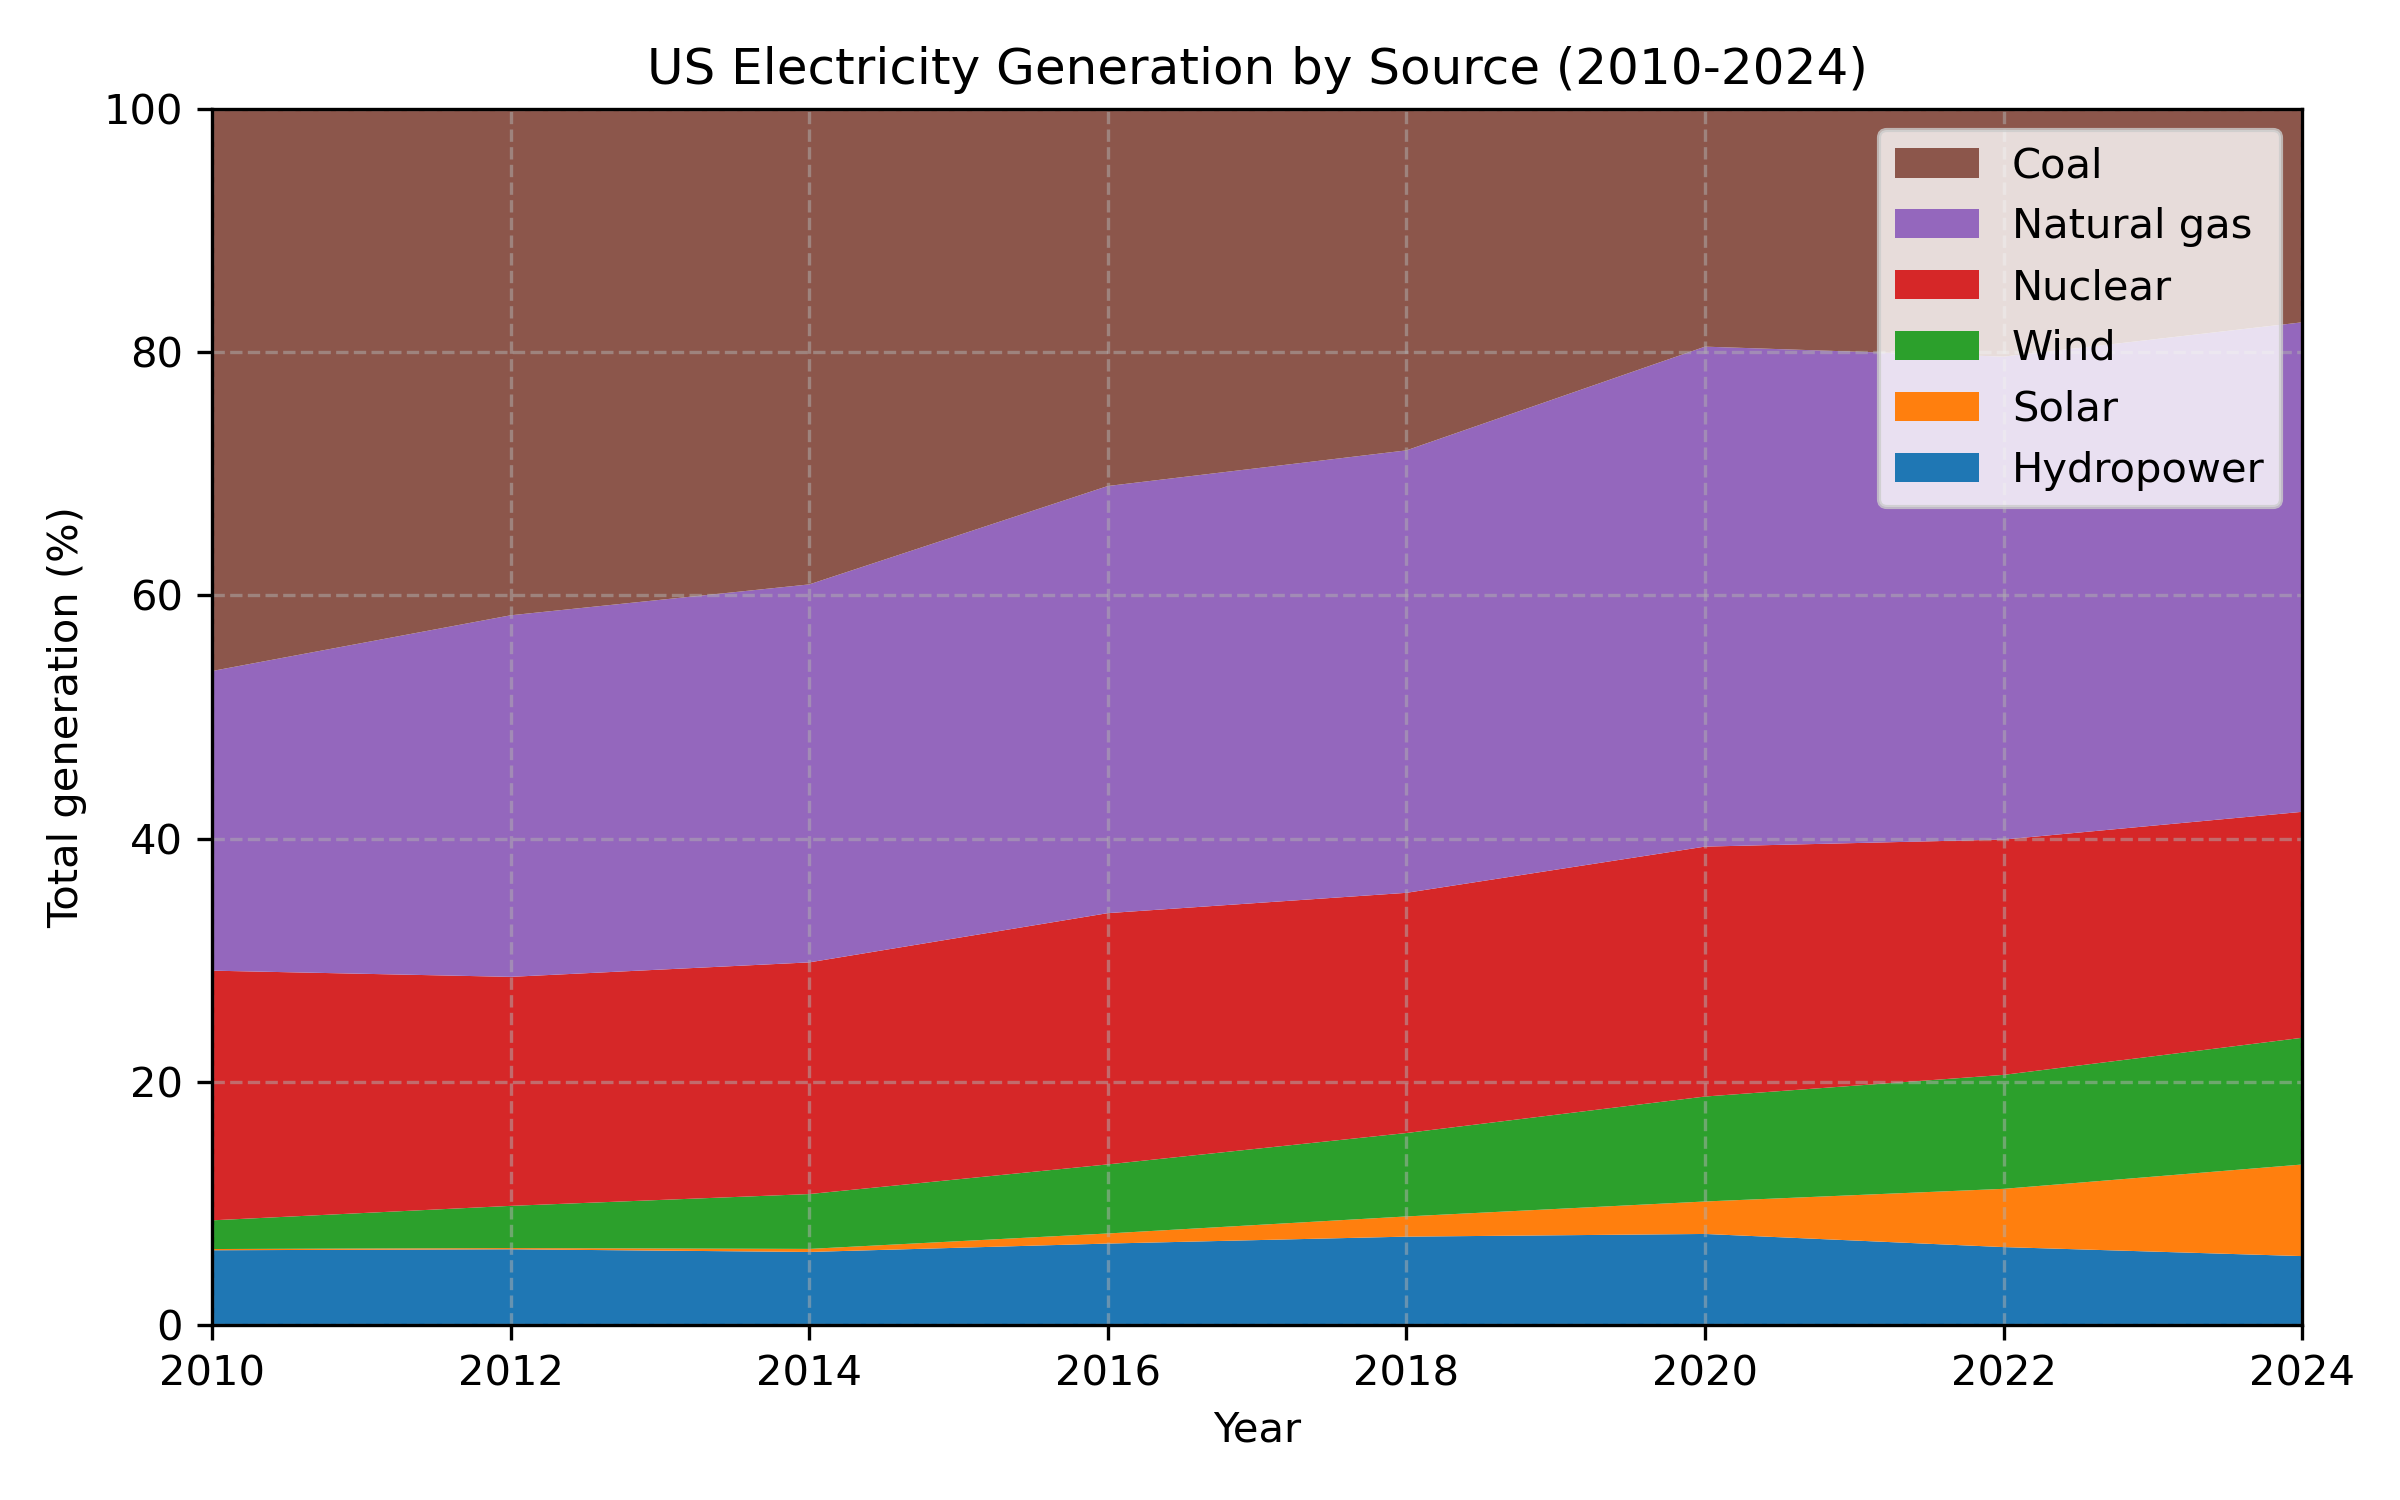
Python‑Generated Trend Figure 📈
The figure below shows an approximate trend of U.S. electricity generation share by major sources (coal, natural gas, nuclear, wind + solar, hydro) from 2010 to 2024. Coal declines steadily, natural gas rises then levels off, nuclear remains roughly constant, and wind/solar increase rapidly.
import matplotlib.pyplot as plt
# normalized shares for US electricity generation (sum to 100%)
years = np.array([2010, 2012, 2014, 2016, 2018, 2020, 2022, 2024])
coal = np.array([46.2, 41.63, 39.1, 30.99, 28.07, 19.53, 20.37, 17.54])
natural_gas = np.array([24.64, 29.73, 31.08, 35.12, 36.38, 41.11, 39.71, 40.25])
nuclear = np.array([20.53, 18.83, 19.05, 20.66, 19.75, 20.55, 19.35, 18.58])
wind = np.array([2.36, 3.47, 4.51, 5.68, 6.86, 8.63, 9.37, 10.42])
solar = np.array([0.1, 0.1, 0.25, 0.83, 1.66, 2.67, 4.79, 7.53])
hydro = np.array([6.16, 6.24, 6.02, 6.71, 7.28, 7.5, 6.42, 5.68])
fig, ax = plt.subplots(figsize=(8,5))
# reverse order for stacking and labels
sources = [hydro, solar, wind, nuclear, natural_gas, coal]
labels = ["Hydropower","Solar","Wind","Nuclear","Natural gas","Coal"]
ax.stackplot(years, sources, labels=labels)
ax.set_title("US Electricity Generation by Source (2010-2024)")
ax.set_xlabel("Year")
ax.set_ylabel("Total generation (%)")
ax.set_ylim(0,100)
ax.set_xlim(2010,2024)
# reverse legend order so Coal shows at top
handles, labels = ax.get_legend_handles_labels()
ax.legend(handles[::-1], labels[::-1], loc="upper right")
ax.grid(True, linestyle="--", alpha=0.5)
plt.tight_layout()
plt.savefig('power_generation_trend.png', dpi=300)
plt.show()
The code uses Matplotlib to build a stacked area chart. Update the years and share arrays with current data from EIA to regenerate the figure.
Electrical power systems convert fuel or renewable energy into electricity, transmit it at high voltage, and distribute it to end users. Engineers must understand how demand and energy charges affect the cost of operating large industrial loads such as data centers. In regulated markets like Utah, demand charges can exceed energy costs, while deregulated markets like ERCOT rely more on per‑kWh pricing. Diversifying generation sources, especially increasing solar and wind, is changing the U.S. electricity mix and reducing reliance on coal.
Quiz: Power Generation
1. Why are high‑voltage lines used to transmit electricity over long distances?
- Incorrect. Transmission frequency stays the same (50/60 Hz).
- Correct. Higher voltage lowers current for a given power, which reduces I²R losses in the lines.
- Incorrect. Reactive power is managed with capacitors/inductors, not by raising transmission voltage.
- Incorrect. Transformers are used at both high and low voltages; high voltage is chosen to reduce losses over distance.
2. Which cost component often dominates the monthly bill for a large Utah industrial customer on Rocky Mountain Power’s Schedule 8?
- Incorrect. Energy charges are lower per kWh; demand charges can be much higher.
- Correct. Demand charges are applied to the peak kW and can exceed energy costs.
- Incorrect. The service fee is a fixed, relatively small monthly charge.
- Incorrect. TDU delivery charges are more relevant in ERCOT; they’re not the largest line item under Schedule 8.
3. A data center draws a constant 1 GW of power for a 30‑day month. Approximately how much energy does it consume?
- Incorrect. 48 MWh would be 1 MW for 48 h; a 1 GW load is much larger.
- Correct. Energy = power × time = 1 GW × 24 h/day × 30 days = 720 GWh.
- Incorrect. 1440 GWh corresponds to 2 GW running for a month (two centers).
- Incorrect. 720 MWh is 0.72 GWh; you’re missing three orders of magnitude.
Exercise 1 (20 min): DC Resistive Loss on a 2 GW HVDC Line (Delta, Utah to California)
A bipolar HVDC link delivers `P = 2\text{GW}` from Delta, Utah to California over `L = 800\text{km}`. The pole-to-pole DC voltage is `V_\text{dc} = 1000\text{kV}` (i.e., `±500\text{kV}` per pole). Assume the per-pole conductor resistance at `20°C` is `r_{20} = 0.008\Omega/\text{km}`. The conductor temperature rises on warm days and falls on cold days; approximate the resistance temperature dependence with aluminum coefficient `\alpha`:
$$\alpha = 0.004/°C \quad R(T) = R_{20}\,\big[1 + \alpha\,(T-20°C)\big]$$
with `R_{20°C} = L \times r_{20}` (per pole). Loss per pole is `I^2 R`, and total line loss is the sum of both poles.
Tasks:
- Compute the DC current `I` at 2 GW and 1000 kV.
- Compute per-pole resistances `R_{20°C}`, `R_{0°C}`, and `R_{40°C}`.
- Compute total line losses (both poles) and percentage of power lost on a cold day (`0°C`) and a warm day (`40°C`).
- Comment on how temperature affects efficiency.
Solution
1) Current
$$I = \dfrac{P}{V_\text{dc}} = \dfrac{2.0\times 10^9\text{W}}{1.0\times 10^6\text{V}} = 2000\text{A}$$
2) Per-pole resistance
$$R_{20°C} = L\,r_{20} = 800\times 0.008 = 6.4\Omega$$
$$R_{0°C} = R_{20°C} [1+\alpha(0-20)] = 6.4 [1-0.08] = 5.888\Omega$$
$$R_{40°C} = R_{20°C} [1+\alpha(40-20)] = 6.4 [1+0.08] = 6.912\Omega$$
3) Losses (both poles) Per pole at `20°C`:
$$P_\text{loss,pole,20} = I^2 R_{20°C} = (2000)^2 \times 6.4 = 25.6\text{MW}$$
Both poles: `P_\text{loss,20} = 51.2 \text{MW}` → `2.56%` of 2 GW.
Cold day `0°C`:
$$P_\text{loss,0} = 2 I^2 R_{0°C} = 2\times (2000)^2 \times 5.888 = 47.104 \text{MW}$$
Percentage: `47.104/2000 = 2.3552%`.
Warm day `40°C`:
$$P_\text{loss,40} = 2 I^2 R_{40°C} = 55.296 \text{MW}$$
Percentage: `55.296/2000 = 2.7648%`.
4) Comment Higher conductor temperature increases resistance and therefore `I^2R` losses; the line is ~`0.41%` less efficient on a warm day vs. a cold day under these assumptions. That is an additional 8.2 MW of energy lost for transmission.
Exercise 2 (15 min): AC Home Power with Refrigerator Energy, `P`, `Q`, `S`, and `pf`
A refrigerator on a `120 \text{V}_\text{rms}` household supply draws a running current of `I = 6 \text{A}`. The running power factor is `pf = 0.85`. Assume it runs with a `30%` duty cycle over a 24 h day. The electricity price is ``$0.13/kWh``. (For interest, the compressor has a startup surge of `I_\text{start}=12 \text{A}`, `pf_\text{start}=0.6` for `0.5 \text{s}`.)
Tasks:
- Compute apparent power `S = V \times I`, real power `P = S \times pf`, reactive power `Q = \sqrt{S^2-P^2}`, and phase angle `\varphi`.
- Estimate daily energy (kWh) and daily cost given the duty cycle.
- (Bonus) Estimate energy used by one startup event and comment on the significance.
Solution
1) Running power quantities $$S = V I = 120 \times 6 = 720\text{VA}$$ $$P = S\,pf = 720 \times 0.85 = 612\text{W}$$ $$Q = \sqrt{S^2 - P^2} = \sqrt{720^2 - 612^2} \approx 379.3\text{var}$$ $$\varphi = \arccos(pf) = \arccos(0.85) \approx 31.8°$$
2) Daily energy and cost Duty time per day: `0.30 \times 24 = 7.2\text{h}` $$E_\text{day} = P \times t = 612\text{W} \times 7.2\text{h} = 4406.4\text{Wh} = 4.4064\text{kWh}$$ Cost: `4.4064\text{kWh} \times \$0.13/\text{kWh} \approx \$0.573/day`
3) Startup event (optional) $$S_\text{start} = 120 \times 12 = 1440\text{VA}$$ $$P_\text{start} = S_\text{start}\,pf_\text{start} = 1440 \times 0.6 = 864\text{W}$$ Duration `0.5\text{s} = 0.0001389\text{h}` $$E_\text{start} = 864\text{W} \times 0.0001389\text{h} \approx 0.12\text{Wh}$$ This is negligible compared with the daily running energy.
Exercise 3 (20 min): Evaluating Billing Options for a Data Center
A company plans to build a 500 MW data center that will operate 24/7. They must estimate monthly electricity costs under two scenarios: (i) connecting to Rocky Mountain Power (RMP) in Utah using Schedule 8, and (ii) connecting to the ERCOT grid in Texas.
Assume:
- Continuous power draw of 500 MW.
- Month length = 30 days.
Rocky Mountain Power
- Peak demand charge: $16.18 per kW (billed on the highest 15‑min on‑peak demand).
- Facilities charge: $4.95 per kW of demand.
- Energy charges:
- 5.9963 ¢/kWh for on‑peak energy
- 3.0478 ¢/kWh for off‑peak.
- On‑peak energy fraction = 30% of total energy and off‑peak = 70%.
ERCOT (Oncor TDU + retail provider)
- Energy rate: 9 ¢/kWh.
- Delivery charge: 3.8447 ¢/kWh.
- No separate demand charge (flat‑rate contract).
Tasks:
- Calculate the monthly energy consumption in GWh for the 500 MW center.
- Estimate the monthly bill under Rocky Mountain Power Schedule 8 using the given demand and energy charges.
- Estimate the monthly bill under ERCOT using the given energy and delivery rates.
- Discuss which option would be cheaper and suggest one strategy the company could use to reduce the electricity cost.
Solution
1. Energy consumption:
- Power = 500 MW = 500,000 kW.
- Time = 24 h/day x 30 days = 720h.
- Energy = P x t = 500,000 kW x 720 h = 360,000,000 kWh = 360 GWh.
2. Rocky Mountain Power (Utah) cost:
- Demand charge = peak kW × $16.18/kW = 500{,}000 kW × $16.18 ≈ $8.09 M.
- Facilities charge = 500,000 kW × $4.95 = $2.48 M.
- Energy charges (on‑peak): 30% of 360 GWh = 108 GWh; cost = 108 million kWh × 0.059963 $ ≈ $6.48 M.
- Energy charges (off‑peak): 70% of 360 GWh = 252 GWh; cost = 252 million kWh × 0.030478 $ ≈ $7.67 M.
- Total RMP bill ≈ $8.09 M + $2.48 M + $6.48 M + $7.67 M = $24.7 M.
3. ERCOT cost:
- Energy cost = 360 million kWh × $0.09 = $32.4 M.
- Delivery cost = 360 million kWh × $0.038447 ≈ $13.8 M.
- Total ERCOT bill ≈ $46.2 M.
4. Comparison and strategy: the RMP tariff is considerably cheaper because the energy rates are low even after adding substantial demand charges. ERCOT’s flat energy + delivery rate produces a higher total cost. To reduce costs in either system, the company could implement demand management strategies to shift non‑critical loads to off‑peak hours, use battery storage to shave peak demand, or invest in on‑site solar to offset daytime energy use and lower grid consumption.