Photoresistor Light Intensity Detection
Light intensity detection is vital in applications like automated lighting, plant monitoring, and environmental sensing. A photoresistor, also known as a light-dependent resistor (LDR), is a simple sensor that changes resistance based on light intensity. The resistance decreases as light intensity increases to detect changes in light levels. Photoresistors are widely used in circuits that need to respond to changes in light conditions. Common applications include night lights, solar trackers, and alarms.
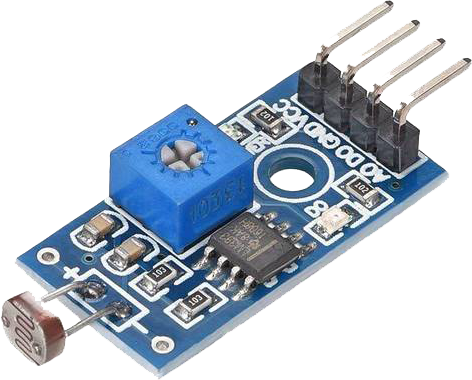
Photoresistor Module
A typical photoresistor module includes an LDR and other components that make it easy to interface with microcontrollers like Arduino or ESP32. The module often has a comparator for digital output and a potentiometer for threshold adjustment, in addition to an analog output that provides a direct measurement of light intensity.
The module can be interfaced with microcontrollers using either analog or digital inputs. Here is an example of how to use the photoresistor module to measure light intensity with a microcontroller (e.g. ESP32) with MicroPython:
import time
do = Pin(2, Pin.IN) # DO (Digital Output) pin
ao = ADC(Pin(4)) # AO (Analog Output) pin
ao.atten(ADC.ATTN_11DB) # Attenuation
for _ in range(20):
print("-"*20)
print("Digital value:", do.value())
print("Analog value:", ao.read())
# Wait 0.5 sec before reading again
time.sleep(0.5)
The line ao.atten(ADC.ATTN_11DB) configures the attenuation setting of the analog-to-digital converter (ADC) channel. The ADC class in MicroPython has the atten method to set the attenuation level. Attenuation is the reduction of the input signal strength and this is important because the range of voltage that the ADC can measure is limited. The attenuation allows the ADC to measure higher voltages than it could without attenuation, by effectively scaling down the input voltage. With ADC.ATTN_11DB there is an 11 dB (decibel) attenuation. The decibel scale is logarithmic, so an 11 dB attenuation means that the input signal is reduced to about 7.9% of the original strength. This setting allows the ADC to read higher voltage values by lowering the voltage that reaches the ADC.
Light Intensity Measurement with a Photoresistor
Experiment with the photoresistor module by measuring light intensity under different conditions. For instance, measure the change in resistance from dark to light conditions and observe how the module output varies.
✅ Activity: Light Intensity Measurement
Here are a few practical applications of a photoresistor:
- Automated Lighting: Use a photoresistor to turn on lights automatically when it gets dark.
- Plant Growth Monitoring: Monitor light levels to ensure optimal conditions for plant growth.
- Security System: Trigger alarm based on changes in light, indicating a potential intrusion to a secure vault.
Experiment with the photoresistor module to record light intensity at different times of the day. Analyze how the light intensity varies and discuss the implications of these findings in terms of potential applications.
Collect Data

Use the following script to collect light intensity data over a 24 hour period with an ESP32. The script records the analog value from the photoresistor every minute.
import time
do = Pin(2, Pin.IN)
ao = ADC(Pin(4))
ao.atten(ADC.ATTN_11DB)
with open('light_data.csv','w') as fid:
fid.write('Time,LDR\n')
st = time.time()
# 1440 minutes in 24 hours
for _ in range(1440):
with open('light_data.csv','a') as fid:
fid.write(f'{(time.time()-st)/60.0},{ao.read()}\n')
print("-"*20)
print("Analog value:", ao.read())
# Wait 60 sec before reading again
time.sleep(60.0)
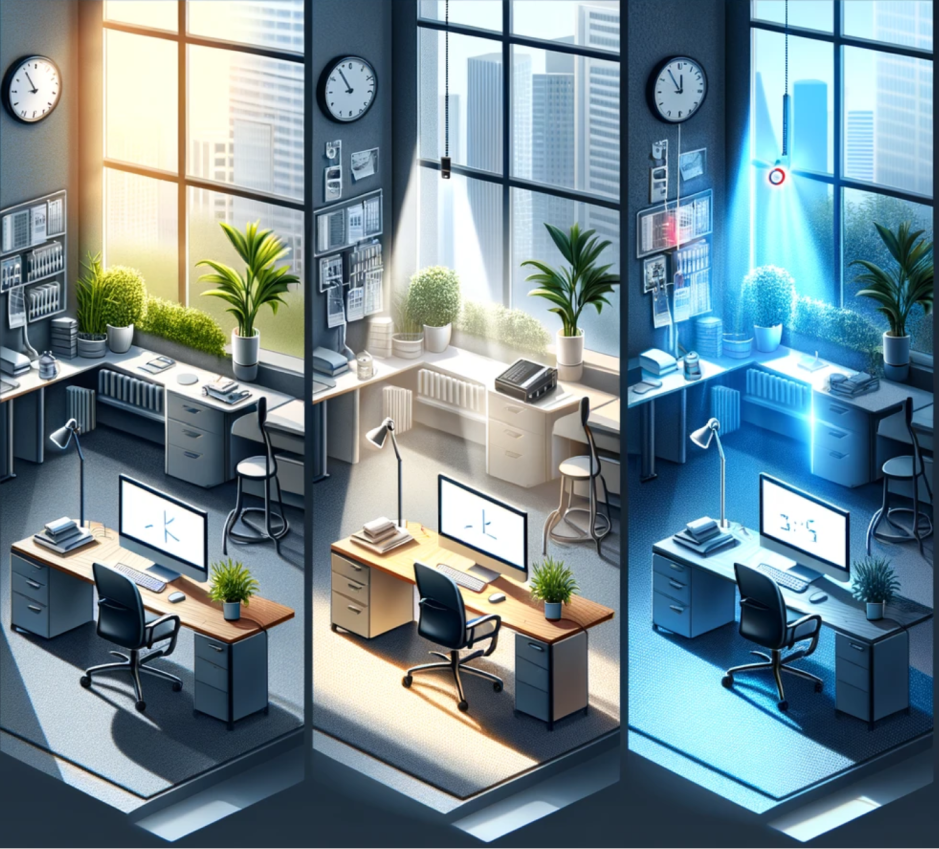
Analyzing light intensity in an office over a 24-hour period with a photoresistor can provide insightful data on various aspects of lighting conditions such as these unique insights:
1. Natural vs. Artificial Light Analysis: By plotting light intensity data, you can distinguish between natural light (sunlight) and artificial light (office lighting). Peaks during sunrise and sunset, as well as variations due to cloud cover, can be observed.
2. Occupancy and Usage Patterns: Changes in light intensity can indicate occupancy patterns in the office. For instance, a sudden increase in light intensity might suggest that lights are being turned on, pointing to human activity.
3. Energy Efficiency Analysis: By understanding when natural light is sufficient and when artificial lighting is used, you can make recommendations for energy-saving strategies, like optimizing the use of natural light or adjusting the timing of artificial lighting systems.
4. Light Quality Analysis: Assessing the quality of light, in terms of brightness and consistency, can provide insights into the work environment. Consistently low light levels may indicate the need for additional lighting for employee comfort and productivity.
5. Circadian Rhythm Analysis: The data can be used to analyze how office lighting aligns with natural circadian rhythms. Poor alignment can impact employee health and productivity, so adjustments to lighting can be made for better synchronization.
6. Seasonal Variations: Over a longer period, this data can reveal seasonal changes in light patterns, which can be crucial for designing lighting systems that adapt to different times of the year.
7. Comparative Analysis: If data is available from different offices or different locations within the same office, comparative analysis can be done to determine the most and least lit areas, helping in optimizing workspace layout.
To visualize the data, create graphs and charts, such as line graphs showing light intensity over time. Use the correlation to convert LDR resistance to light intensity (lux):
$$\log_{10}(lux)=-1.4 \log_{10}(LDR)+7.1$$
Plot the data to determine lux throughout the day. Analyze the plot to determine when there is sufficient light in the room.
Solution
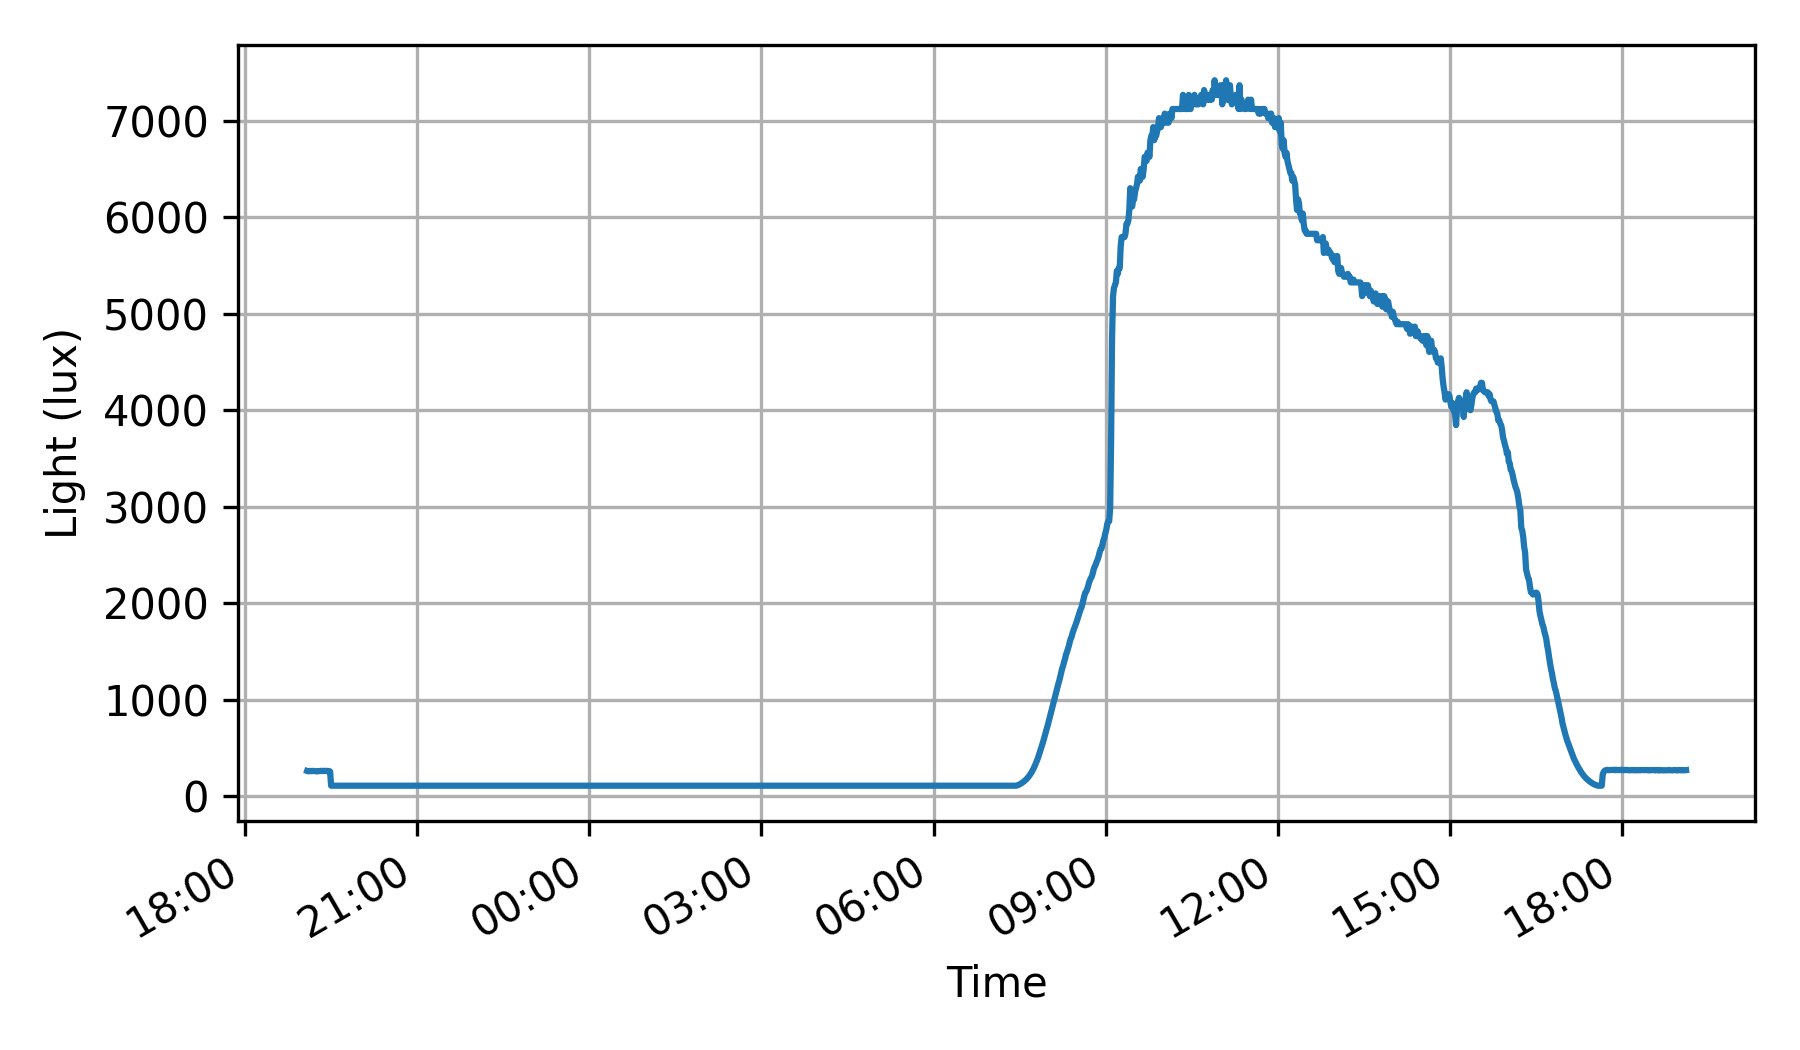
The light data shows that the office light is around 200 lux and during the day (cloudless), the lux exceeded 7000 lux. The abrupt increase in light occurred at 9:10 AM as sunlight broke over the mountains. The highest intensity occurred in the morning with nearby buildings shading the area outside the windows in the afternoon. The data collection started at 7:05 PM and ended 24 hours later.
For typical office and computer-related work, which involves activities like reading, writing, and using computers, the recommended light level is around 500 lux. This level is conducive to productivity and reduces eye strain. In areas where detailed or prolonged visual tasks are performed, such as in design or technical drawing, the light level may need to be increased to 1000 lux or more. This analysis shows that the office light level should be increased from 200 lux to 500 lux. Window shades may be needed to control the high lux during a sunny day.
import matplotlib.pyplot as plt
import matplotlib.dates as mdates
import datetime
import numpy as np
url = 'http://apmonitor.com/dde/uploads/Main/light_data.csv'
data = pd.read_csv(url)
# Starting time is 7:05 PM on Dec 28, 2023
st = datetime.datetime(2023, 12, 28, 19, 5)
# Create a time range based on Time
tr = [st + datetime.timedelta(minutes=x) \
for x in data['Time']]
# Add time range to DataFrame
data['Time'] = tr
data['Light'] = 10**(-1.4*np.log10(data['LDR'].values)+7.1)
# Create plot
data.set_index('Time',inplace=True,drop=True)
data['Light'].plot(figsize=(6,3.5),subplots=True)
plt.gca().xaxis.set_major_formatter(mdates.DateFormatter('%H:%M'))
plt.ylabel('Light (lux)')
plt.grid(); plt.tight_layout()
plt.show()