App Development with Python
Applications can be built using various frameworks, each suited to specific use cases. Popular frameworks include Flutter, React Native, Android Studio, Ionic, SwiftUI, and others. These frameworks offer diverse approaches to app development:
- Flutter: A Dart-based framework from Google. Ideal for cross-platform applications with a single codebase. Offers high performance but requires Dart expertise.
- React Native: Built on JavaScript and React. Known for its ability to reuse code across iOS and Android platforms. Tradeoff: slower than native apps for performance-intensive tasks.
- Android Studio: A robust IDE tailored for native Android apps. While it provides extensive tools, it's platform-specific and requires Java/Kotlin expertise.
- Ionic: A framework for hybrid apps using web technologies (HTML, CSS, JavaScript). Best for rapid development but may lack native-like performance.
- SwiftUI: Apple’s framework for native iOS applications, utilizing Swift. Highly integrated with Apple’s ecosystem but restricted to iOS and macOS platforms.

Python developers have an alternative option in Streamlit, a framework designed to create interactive web applications. While Streamlit isn't suited for mobile-first designs, it is effective for dashboards, data visualization, and machine learning workflows. Below are examples of how to build interactive apps using Streamlit.
Start with Streamlit
Streamlit turns Python scripts into shareable web apps without needing front-end expertise. Below is a step-by-step guide:
Install and Test
streamlit hello
Hello World App
Save the following code as app.py:
st.title("Hello, Streamlit!")
st.write("This is a simple Streamlit application.")
Run the app:
Visit the provided local URL in your browser to view the app.
Basic Functions in Streamlit
Streamlit provides easy-to-use widgets for interactivity. Below are tutorials on common functionalities.
Slider Input
Use sliders to collect user input and dynamically update results.
st.title("Slider Example")
number = st.slider("Pick a number", min_value=0, max_value=100, step=5, value=25)
st.write(f"You selected: {number}")

How it works: The st.slider() function generates a slider widget. The selected value updates dynamically, and you can use it in calculations or visualizations.
Display Data
Visualize tabular data directly with Streamlit’s built-in functionality.
import pandas as pd
st.title("DataFrame Example")
data = {'Column A': [1, 2, 3], 'Column B': [4, 5, 6]}
df = pd.DataFrame(data)
st.write("Here is a table:")
st.dataframe(df)
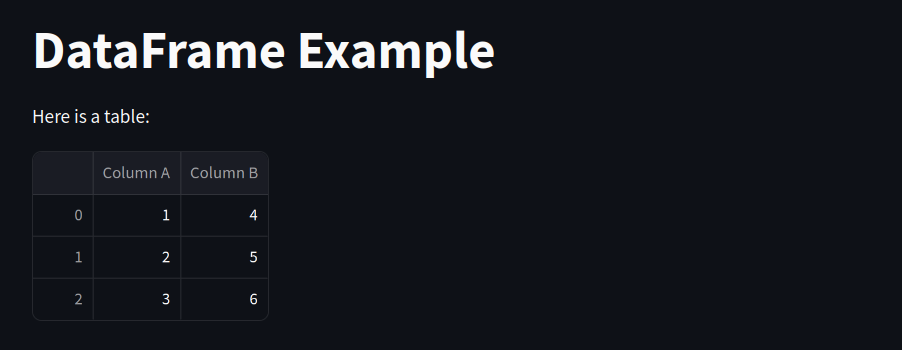
How it works: Use st.dataframe() to render Pandas DataFrames interactively.
Interactive Charts
Streamlit integrates well with libraries like Matplotlib and Plotly. Below is a line chart example with a built-in streamlit plot and with matplotlib.
import numpy as np
import pandas as pd
st.title("Line Chart Example")
# Generate data
data = pd.DataFrame(
np.random.randn(50, 3),
columns=["A", "B", "C"]
)
# Display chart
st.line_chart(data)
import matplotlib.pyplot as plt
import numpy as np
st.title("Matplotlib Chart Example")
# Data for plotting
x = np.linspace(0, 10, 100)
y = np.sin(x)
fig, ax = plt.subplots()
ax.plot(x, y, label="Sine Wave")
ax.legend()
# Render plot
st.pyplot(fig)
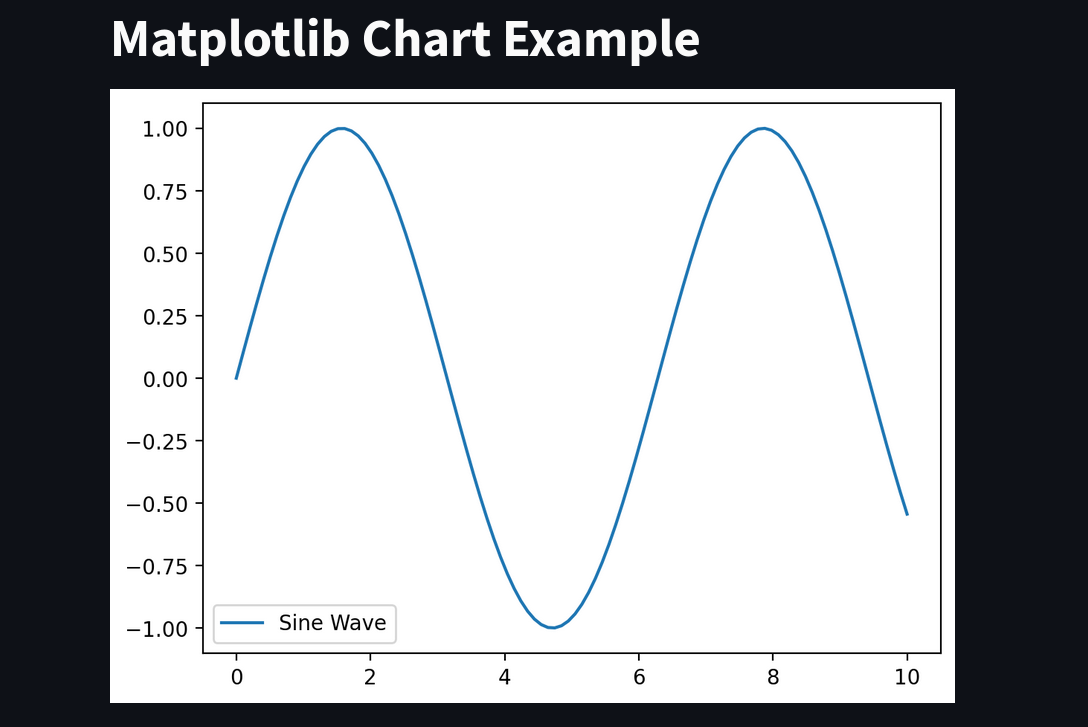
User Input with Text and Buttons
Streamlit handles text input and button actions.
st.title("Text and Button Example")
# Text Input
user_input = st.text_input("Enter your name", "")
if st.button("Submit"):
st.write(f"Hello, {user_input}!")
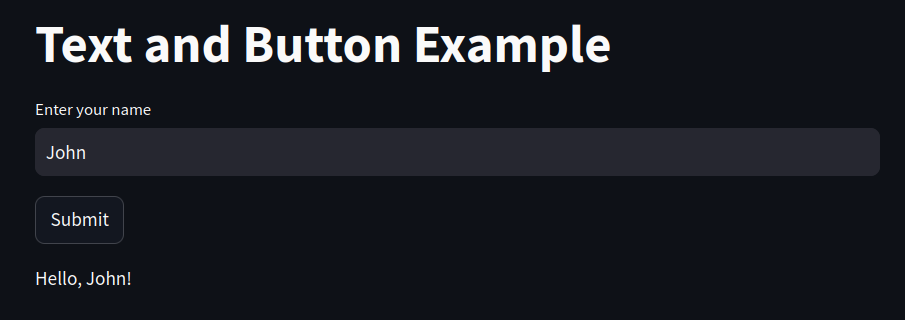
How it works: st.text_input() collects string data, and st.button() triggers actions.
App Examples
Below is a more advanced example integrating sliders, data, and charts.
import pandas as pd
import numpy as np
import matplotlib.pyplot as plt
st.title("Interactive Data App")
# Slider for data size
data_size = st.slider("Select Data Size", 10, 500, 100)
# Generate random data
data = pd.DataFrame({
"X": np.random.rand(data_size),
"Y": np.random.rand(data_size)
})
# Select chart type
chart_type = st.radio("Choose Chart Type", ["Scatter", "Line"])
# Display data and chart
st.write("Generated Data:", data)
if chart_type == "Scatter":
fig, ax = plt.subplots()
ax.scatter(data["X"], data["Y"])
st.pyplot(fig)
else:
st.line_chart(data)
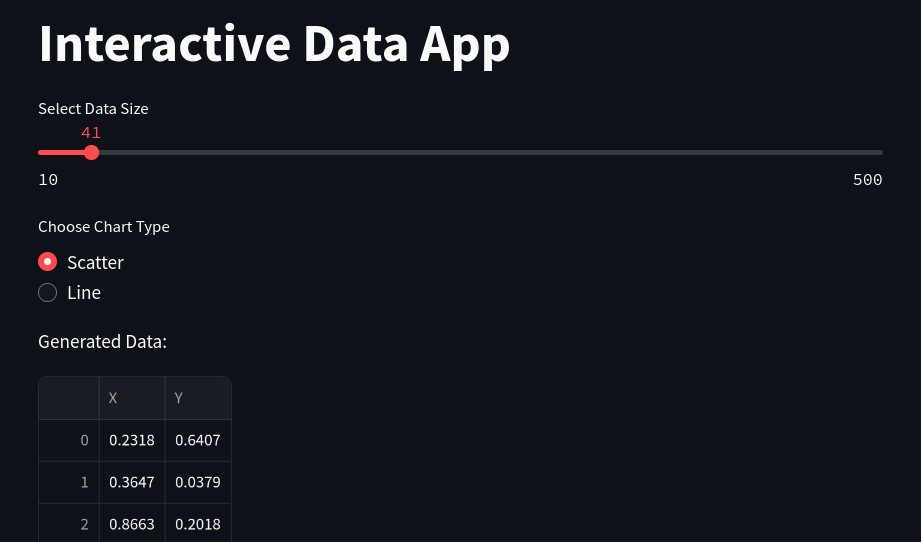
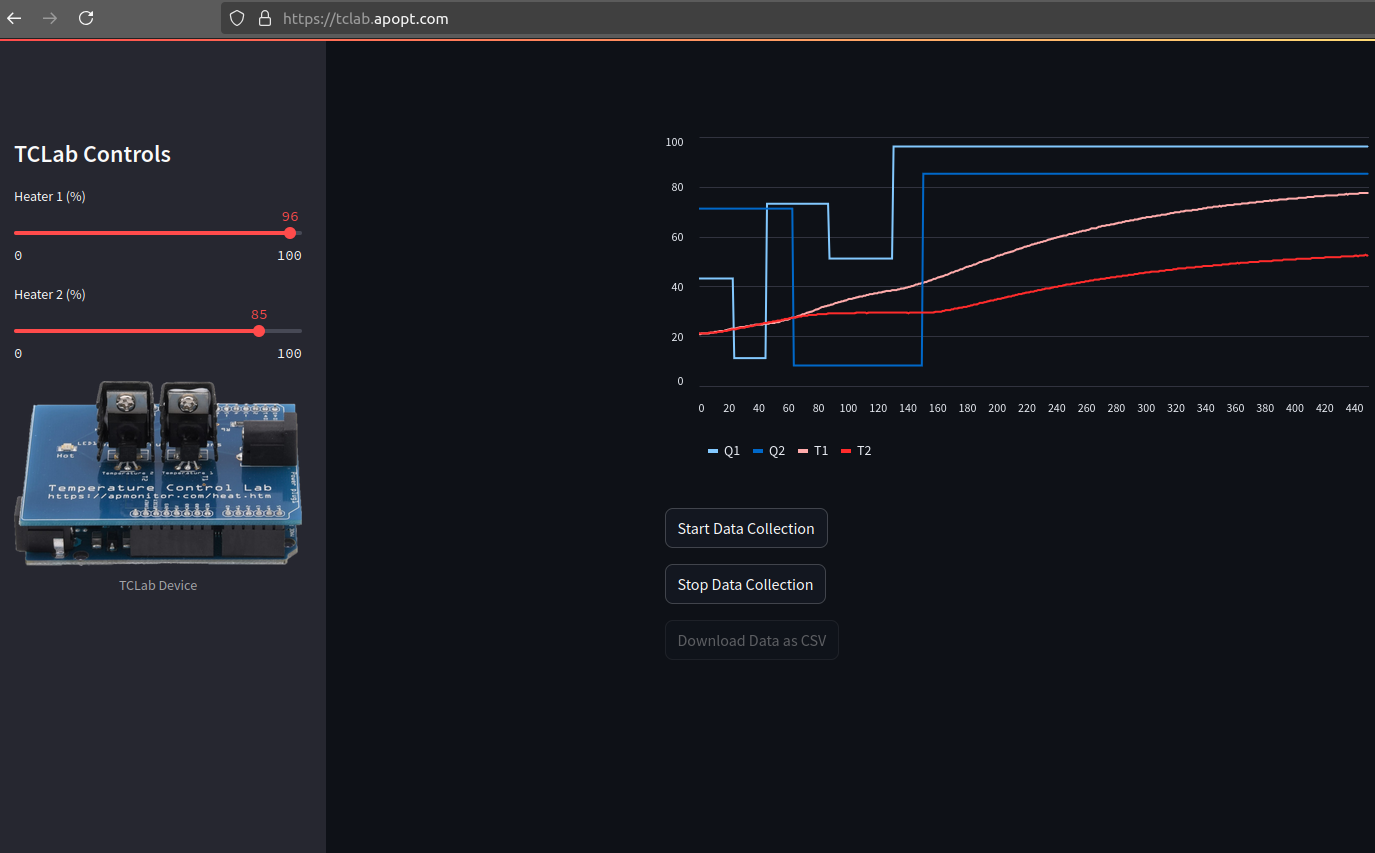
Another example simulates the TCLab temperature responses with heater slider bars to control the heater levels.
import pandas as pd
import numpy as np
import time
import tclab
# Check for hardware availability and set up TCLab
hardware = False
# Uncomment when running locally to use the TCLab
#tclab_hardware = st.checkbox("Use TCLab hardware", value=False)
#hardware = tclab_hardware.value
# Initialize session state variables for data persistence
if "collecting_data" not in st.session_state:
st.session_state.collecting_data = False
st.session_state.timestamps = []
st.session_state.time = []
st.session_state.T1_list = []
st.session_state.T2_list = []
st.session_state.Q1_list = []
st.session_state.Q2_list = []
# Sidebar for controls to save space
st.sidebar.title("TCLab Controls")
Q1 = st.sidebar.slider("Heater 1 (%)", 0, 100, 0)
Q2 = st.sidebar.slider("Heater 2 (%)", 0, 100, 0)
if hardware:
LED = st.sidebar.slider("LED Brightness (%)", 0, 100, 0)
# Add image under controls
url = "https://apmonitor.com/pdc/uploads/Main/tclab_transparent.png"
# In case URL isn't available
try:
st.sidebar.image(url, caption="TCLab Device")
except:
pass
# Create empty placeholder for the real-time line chart
combined_chart = st.empty()
# Start/Stop buttons
if st.button("Start Data Collection"):
st.session_state.collecting_data = True
st.session_state.timestamps = []
st.session_state.time = []
st.session_state.T1_list = []
st.session_state.T2_list = []
st.session_state.Q1_list = []
st.session_state.Q2_list = []
if hardware:
TCLab = tclab.setup(connected=True)
else:
TCLab = tclab.setup(connected=False, speedup=10)
st.session_state.lab = TCLab()
if st.button("Stop Data Collection"):
st.session_state.collecting_data = False
st.session_state.lab.close()
# Main loop for data collection
if st.session_state.collecting_data:
with st.session_state.lab:
# Start data collection loop
for t in tclab.clock(600): # Collect data for up to 600 seconds
if not st.session_state.collecting_data:
break # Exit loop if Stop button is pressed
# Read temperatures
T1 = st.session_state.lab.T1
T2 = st.session_state.lab.T2
# Update data lists in session state
if not st.session_state.time:
st.session_state.time.append(0)
else:
st.session_state.time.append(st.session_state.time[-1]+1)
st.session_state.timestamps.append(t)
st.session_state.Q1_list.append(Q1)
st.session_state.T1_list.append(T1)
st.session_state.Q2_list.append(Q2)
st.session_state.T2_list.append(T2)
# Update heaters and LED based on slider values
st.session_state.lab.Q1(Q1)
st.session_state.lab.Q2(Q2)
if hardware:
st.session_state.lab.LED(LED)
# Update DataFrame with new data
data = pd.DataFrame({
"Time": st.session_state.time,
"Q1": st.session_state.Q1_list,
"T1": st.session_state.T1_list,
"Q2": st.session_state.Q2_list,
"T2": st.session_state.T2_list
})
# Update real-time line chart with both temperature and heater data
combined_chart.line_chart(data[["Q1", "T1", "Q2", "T2"]])
# Small pause
if not hardware:
time.sleep(0.1)
# Convert data to DataFrame for downloading
if len(st.session_state.timestamps) > 0:
data = pd.DataFrame({
"Time (s)": np.arange(0,len(st.session_state.timestamps)),
"Q1": st.session_state.Q1_list,
"T1": st.session_state.T1_list,
"Q2": st.session_state.Q2_list,
"T2": st.session_state.T2_list
})
# Download button for the data
csv = data.to_csv(index=False)
st.download_button(
label="Download Data as CSV",
data=csv,
file_name="tclab_data.csv",
mime="text/csv"
)
st.session_state.collecting_data = False
else:
st.write("No data collected yet.")
Use Cases
- Data Dashboards: Quickly build dashboards to monitor metrics.
- Machine Learning Prototypes: Develop interactive interfaces for model inputs and outputs.
- Education: Use it as a teaching tool for interactive visualizations.
Streamlit is a powerful option for prototyping and data-driven applications. However, it is not designed for mobile-first or highly customized user interfaces.
