Automotive Monitoring
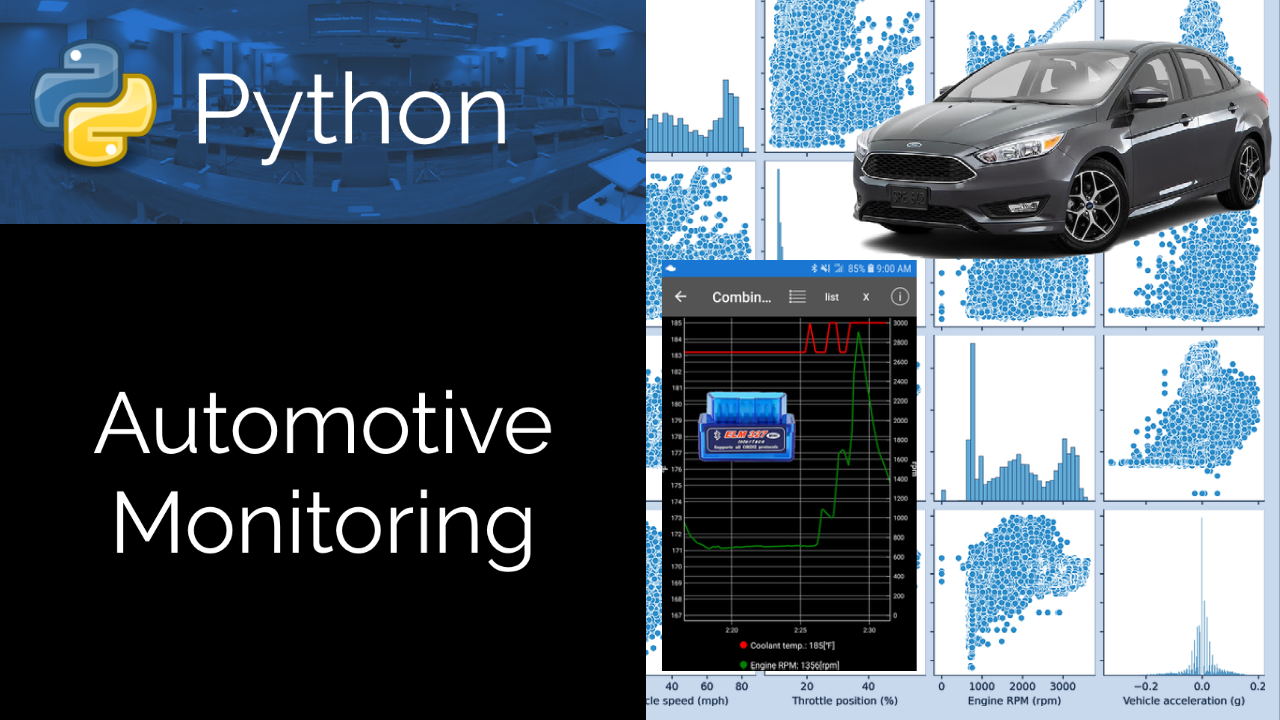
Background: Automotive data is available from OBD-II codes that are standard for engine monitoring of light duty vehicles (passenger cars) starting in year 1996. Newer vehicles may include additional sensors from other electronic systems such as the brake system, tire pressure, climate control, and transmission. Data is processed with on-board computers to monitor the health of the vehicle systems and provide warning diagnostics when there is an indication of malfunction.
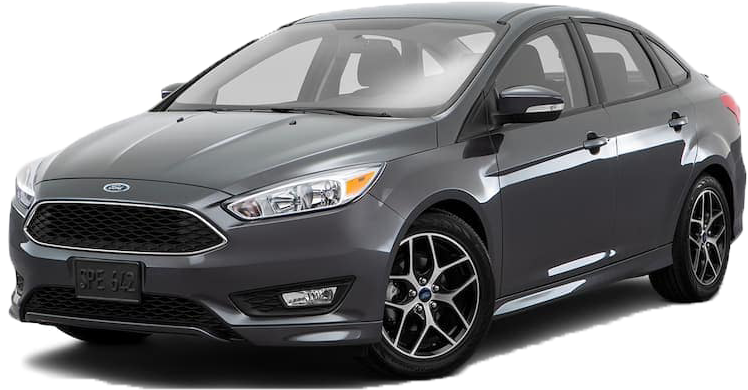
 Data: Data is collected from a 2014 Ford Focus (manual transmission) and a 2021 Chrysler Pacifica minivan with city and freeway driving:
- Automotive Warmup (30 min), 62 columns, Ford
- Provo to St. George, Utah (~8 hrs), 40 columns, Ford
- Provo to Salt Lake City, Utah (~2 hrs), 22 columns, Ford
- Des Moines to Pella, Iowa (~1 hr), 46 columns, 2021 Chrysler
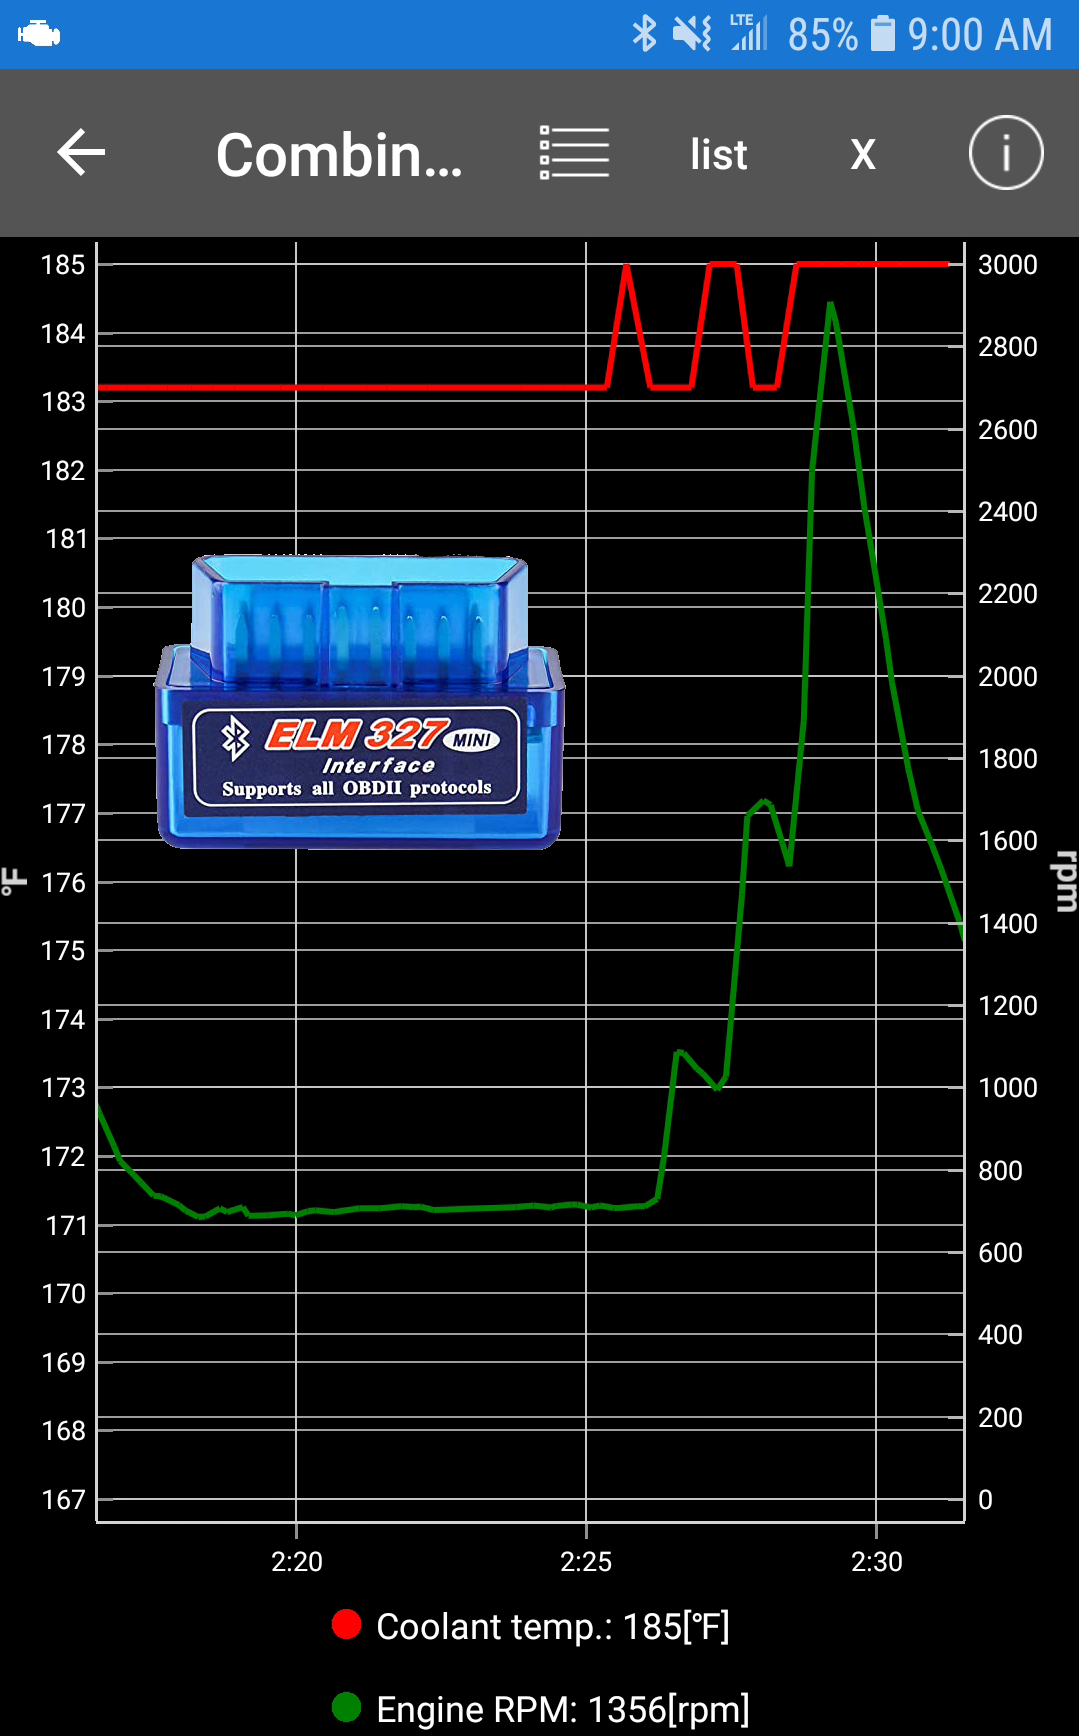
Data sets 1 and 2 are collected with the ELM327 module with raw sensor data and calculated values that are collected with Car Scanner (App) from the OBD-II codes through a Bluetooth connection. Data set 3 is collected with an OBDLink MX+ OBD-II module through a Bluetooth connection.
  # warm-ups since codes cleared ()
  A/C pressure (kPa)
  Absolute load value (%)
  Absolute pedal position D (%)
  Absolute pedal position E (%)
  Absolute throttle position B (%)
  Air:fuel ratio ()
  Altitude (GPS) (feet)
  Ambient air temperature (℉)
  Average fuel consumption (MPG)
  Average fuel consumption (total) (MPG)
  Average fuel consumption 10 sec (MPG)
  Average speed (mph)
  Average speed (GPS) (mph)
  Barometric pressure (kPa)
  Calculated boost (bar)
  Calculated engine load value (%)
  Calculated instant fuel rate (gal./h)
  Catalyst temperature Bank 1 Sensor 1 (℉)
  Commanded evaporative purge (%)
  Commanded throttle actuator (%)
  Control module voltage (V)
  Distance traveled since codes cleared (miles)
  Distance traveled with MIL on (miles)
  Distance travelled (miles)
  Distance travelled (total) (miles)
  Engine coolant temperature (℉)
  Engine RPM (rpm)
  Ethanol fuel percent (%)
  Evap. system vapor pressure (Pa)
  Fuel economizer (based on fuel system status and throttle position) ()
  Fuel level input (%) (%)
  Fuel level input (V) (gallon)
  Fuel rail press. (kPa)
  Fuel used (gallon)
  Fuel used (total) (gallon)
  Fuel used price ($)
  Fuel used price (total) ($)
  Fuel/Air commanded equivalence ratio ()
  Instant engine power (based on fuel consumption) (hp)
  Intake air temperature (℉)
  Knock retard (°)
  Lambda ()
  Learned octane ()
  Long term fuel % trim - Bank 1 (%)
  MAF air flow rate (g/sec)
  OBD Module Voltage (V)
  Oxygen sensor 1 Wide Range Current (mA) (mA)
  Oxygen sensor 1 Wide Range Equivalence ratio ()
  Oxygen sensor 2 Bank 1 Short term fuel trim (%)
  Oxygen sensor 2 Bank 1 Voltage (V)
  Power from MAF (hp)
  Relative throttle position (%)
  Short term fuel % trim - Bank 1 (%)
  Speed (GPS) (mph)
  Throttle position (%)
  Throttle Position Actually (°)
  Throttle Position Desired (°)
  Timing advance (°)
  Transmission Odometer (℉)
  Vane position sensor (V)
  Variable camshaft actual advance #1 (°)
  Vehicle acceleration (g)
  Vehicle speed (mph)
  Latitude
  Longitude
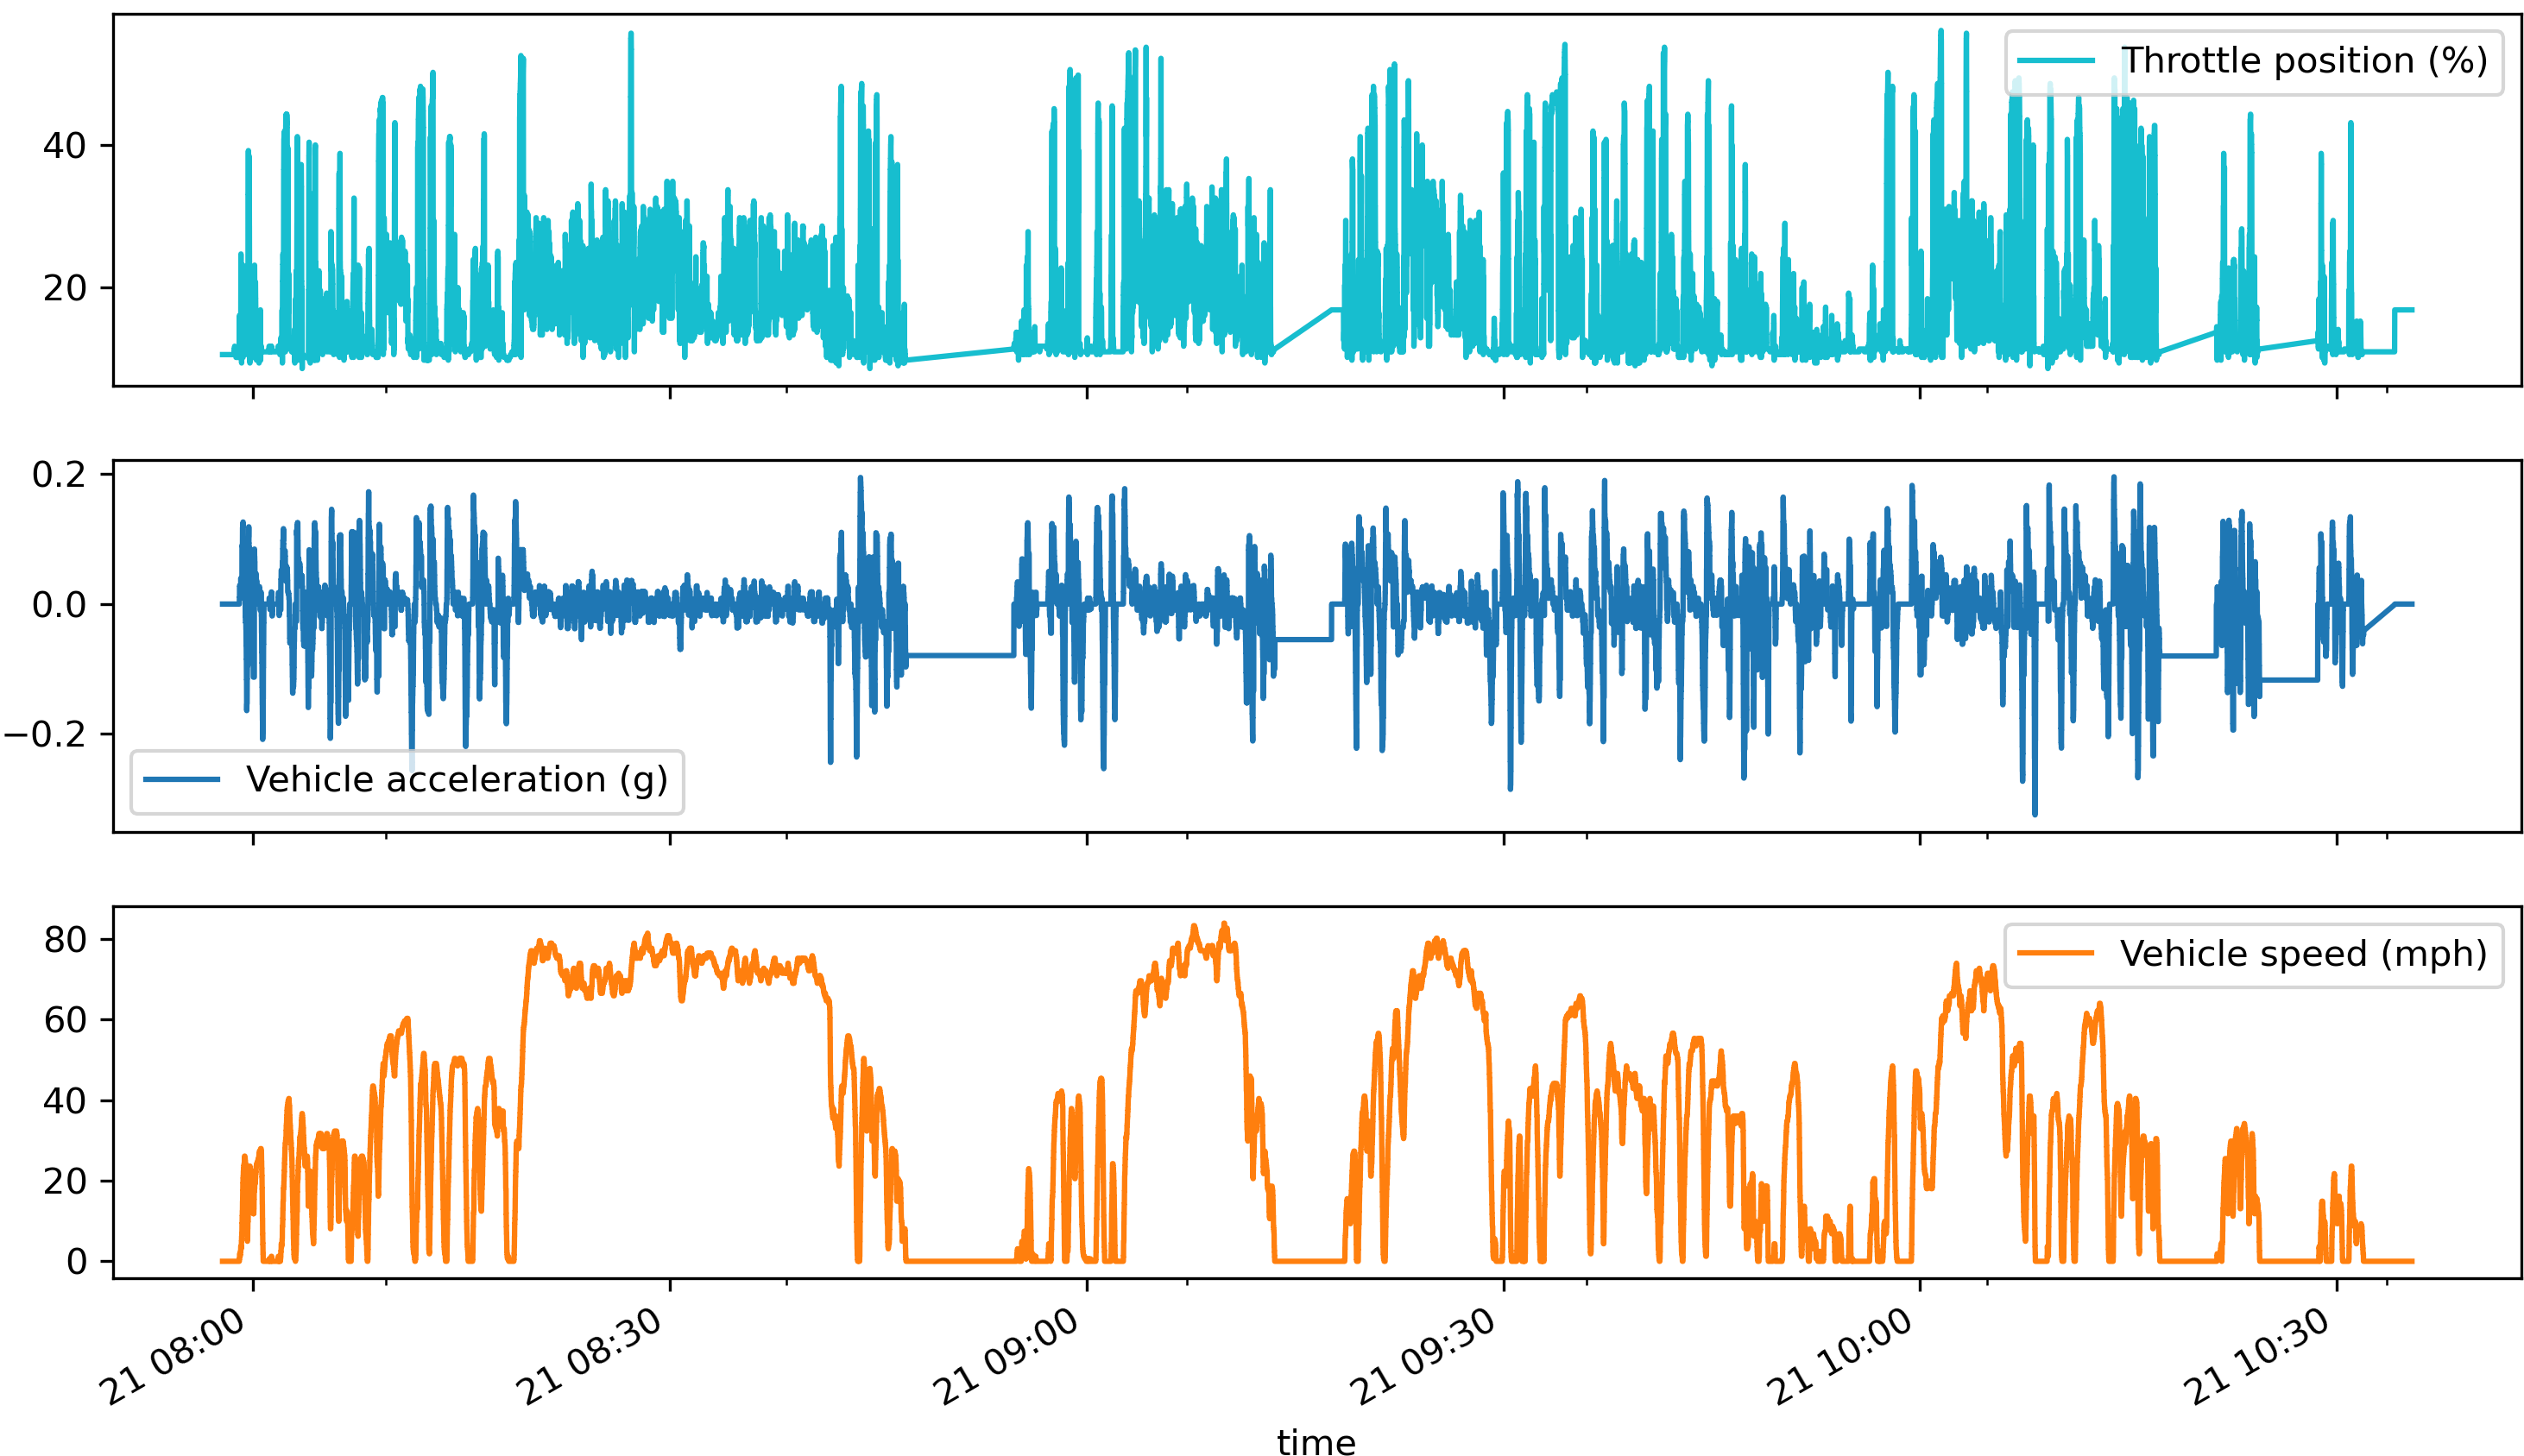
Objective: Investigate driver and automobile performance. Use an OBD-II reader and collect data from a vehicle. Analyze the following:
- Determine Light-off Time of the Catalytic Converter
- Visualize the Speed and Elevation on a Map
- Find maximum fuel economy versus speed
Example data is provided for each sample solution.
url = 'http://apmonitor.com/pds/uploads/Main/automotive.txt'
data = pd.read_csv(url)


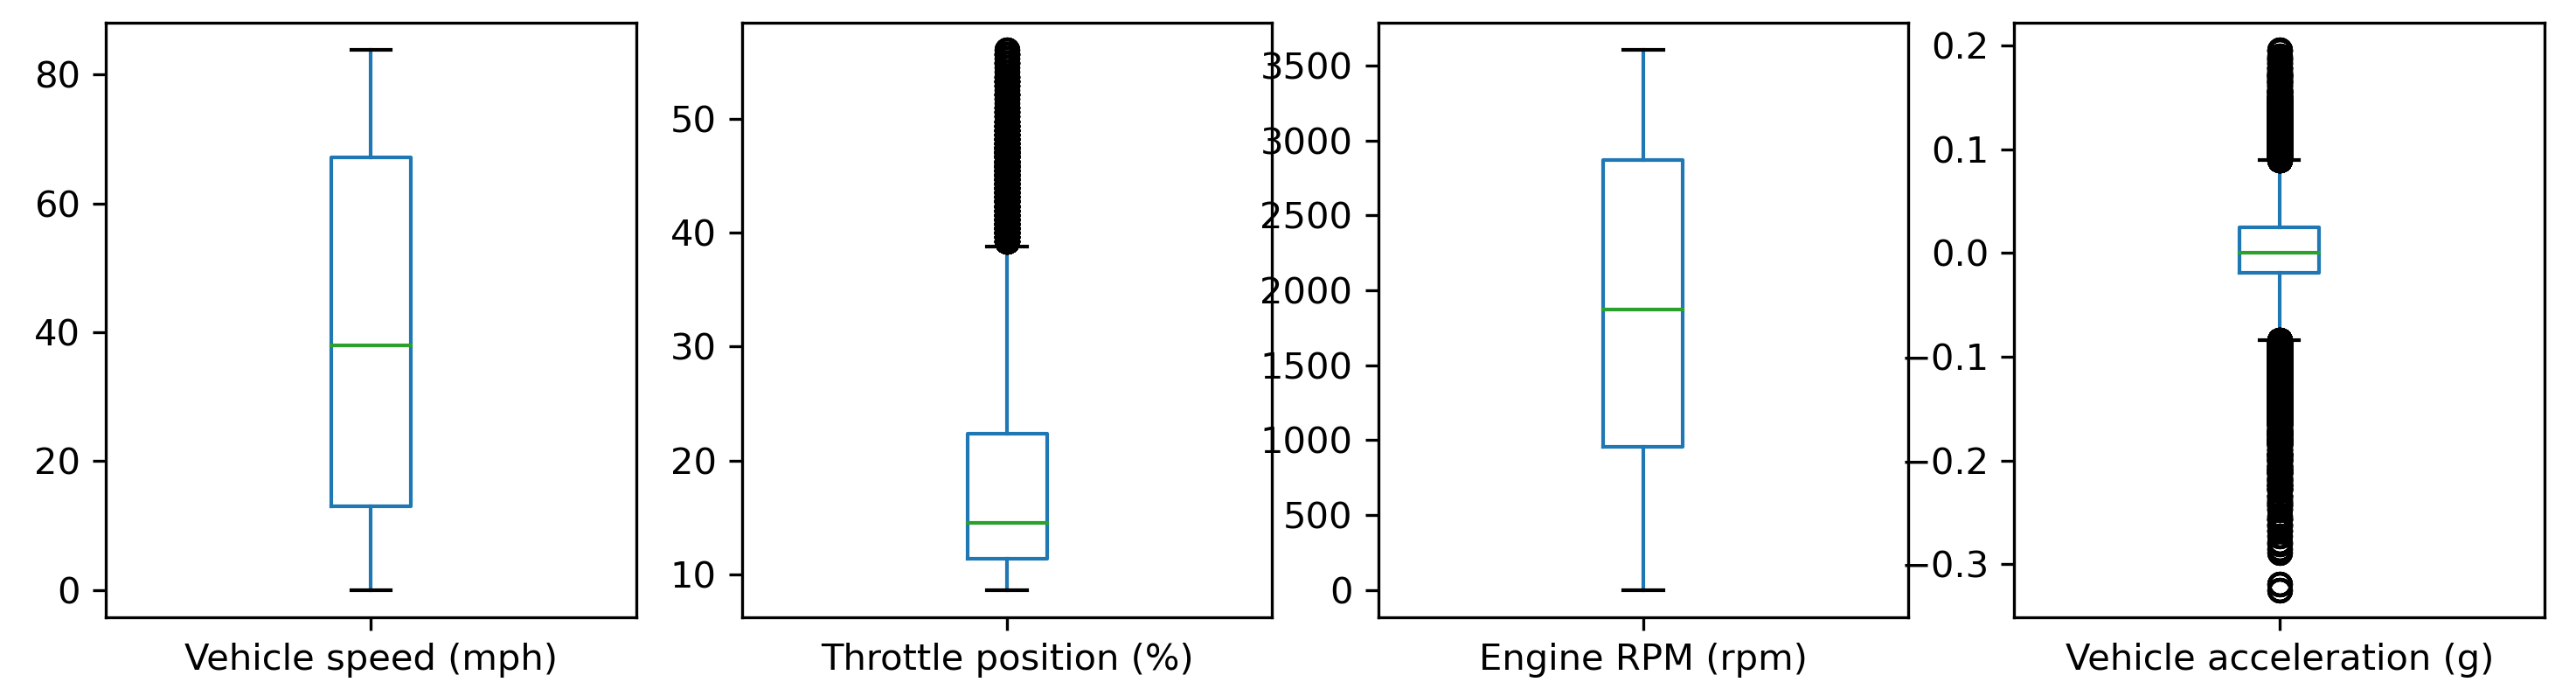
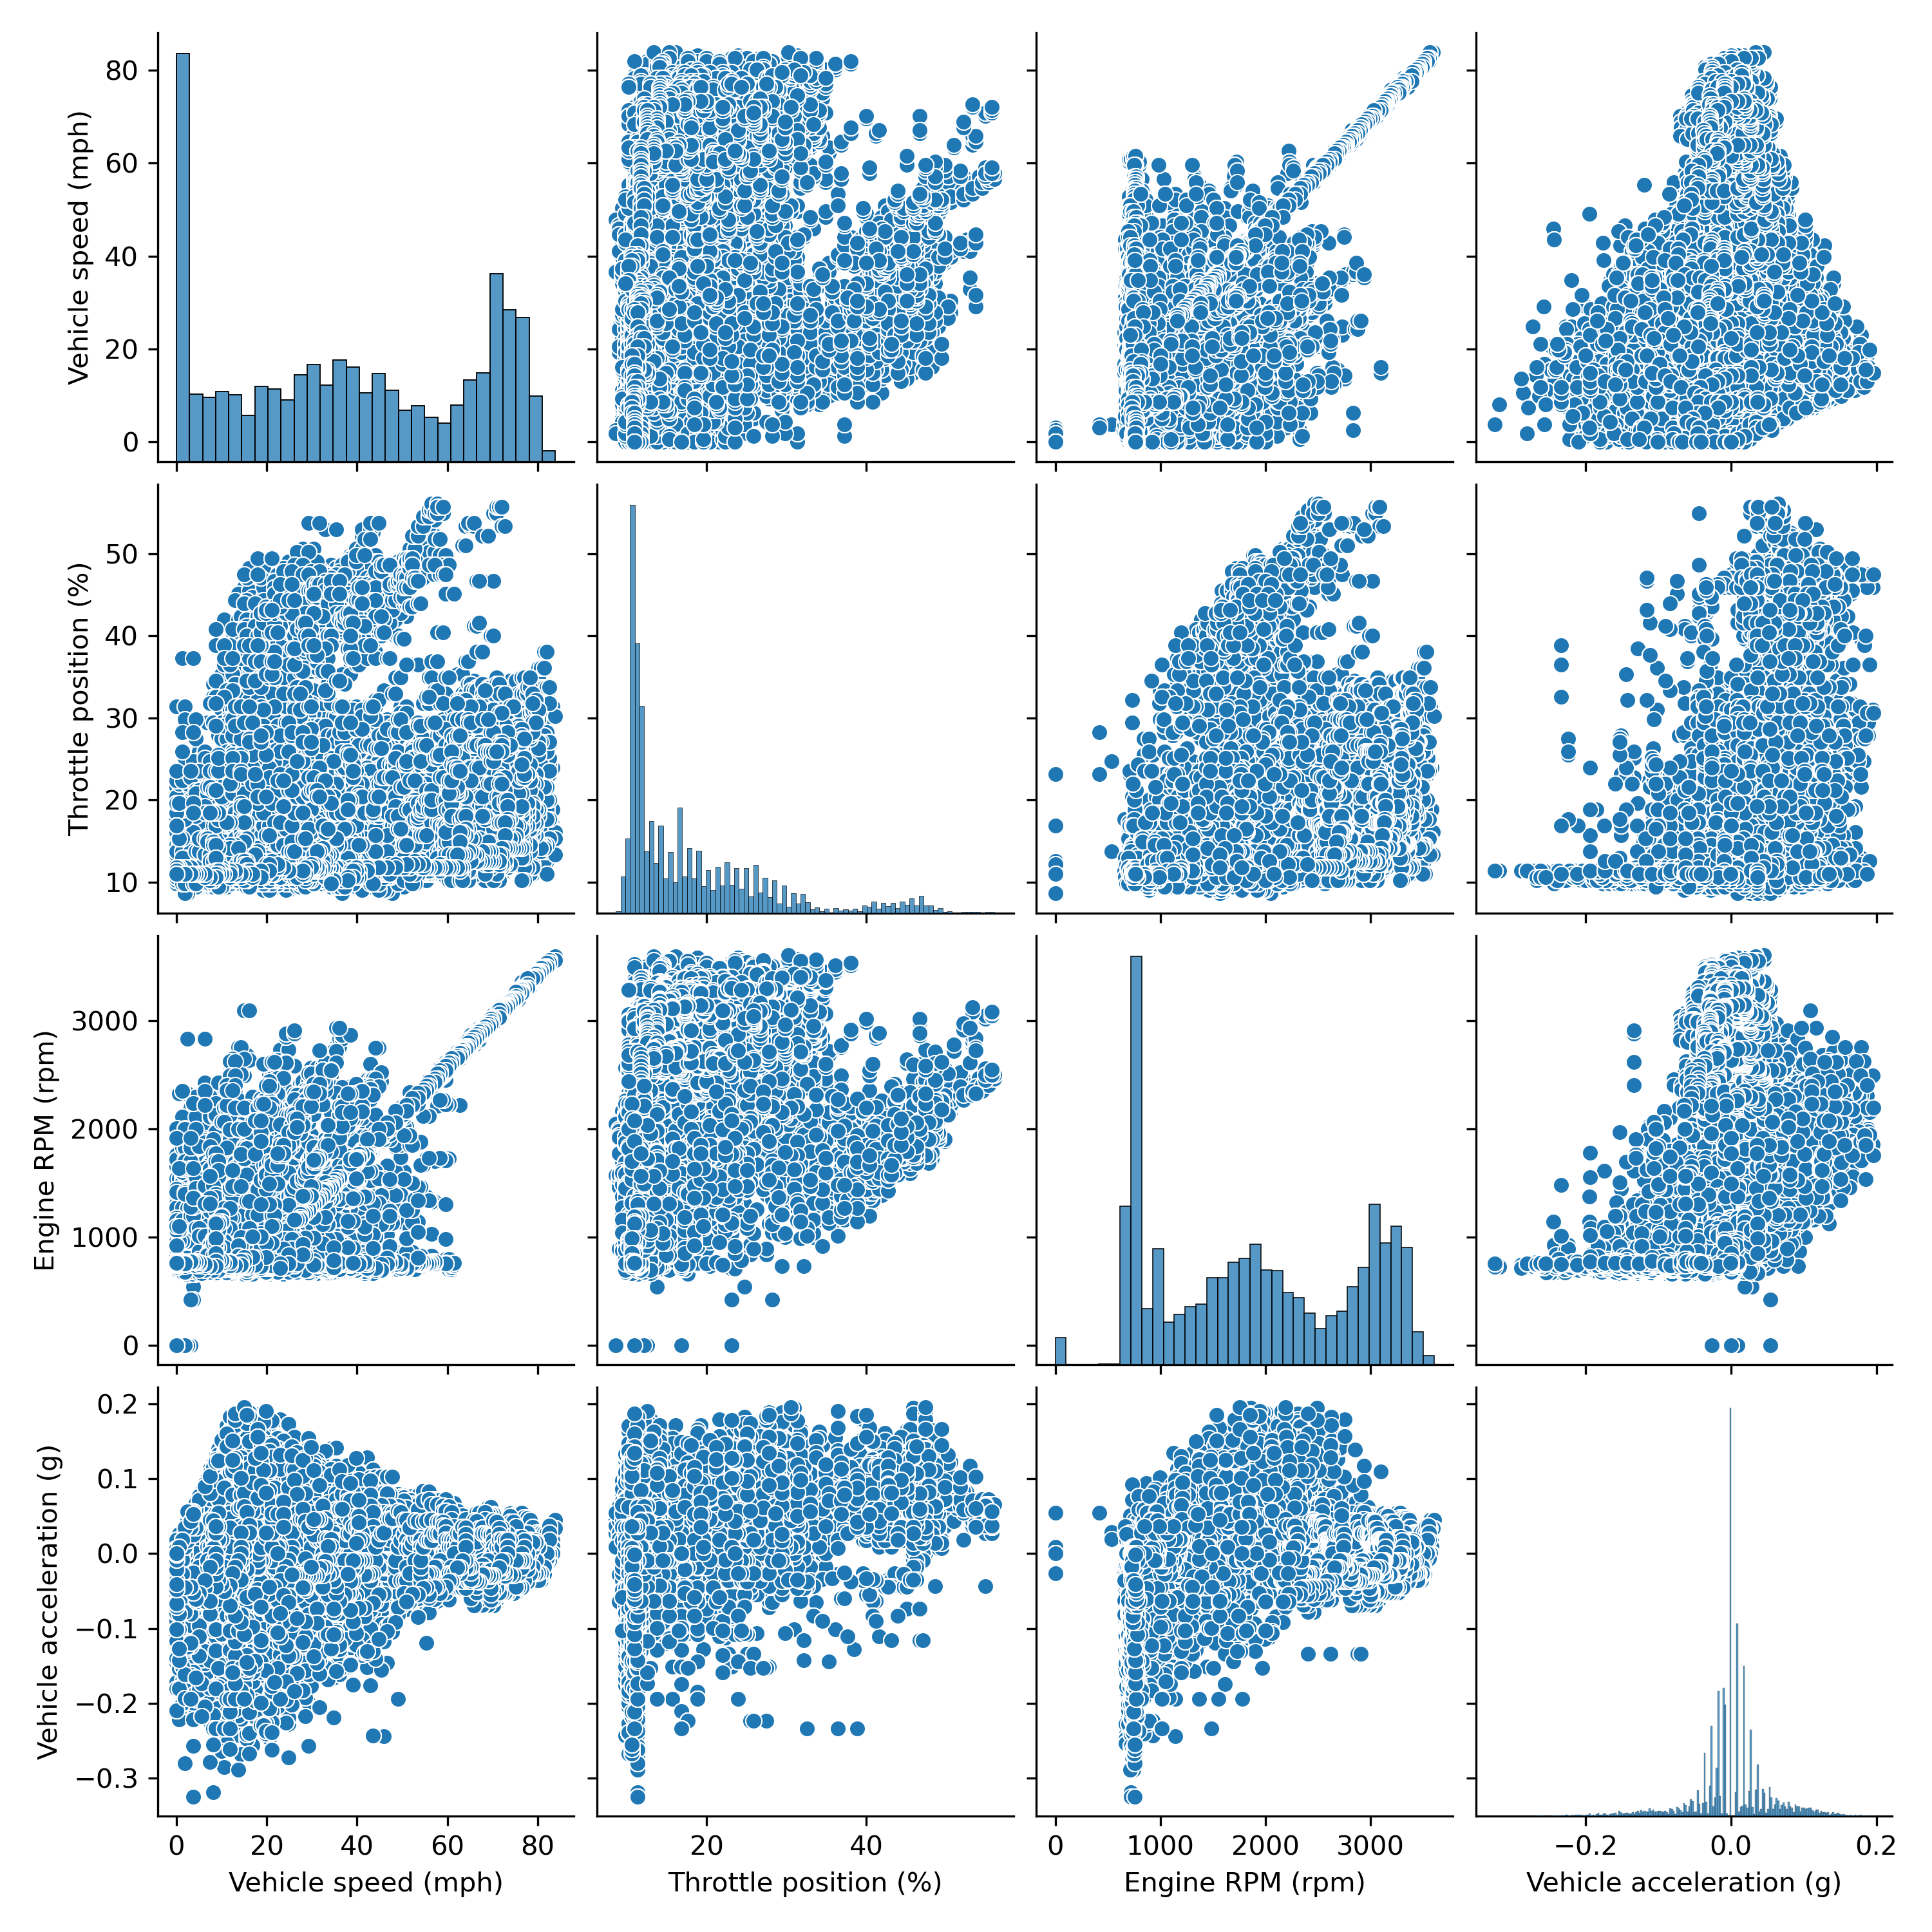
Box Plot
Parity Plot
Case Study 1: Catalyst Light-Off
The catalyst light-off temperature is a minimum temperature to initiate the catalytic reaction. Before light-off temperature is reached, the catalytic converter is less effective at reducing the pollutants. A typical light-off temperature is between 400 to 600 degrees F. The normal operating temperature is between 750 to 1,600 degrees F. The operating temperature increases with more pollutants in the exhaust.
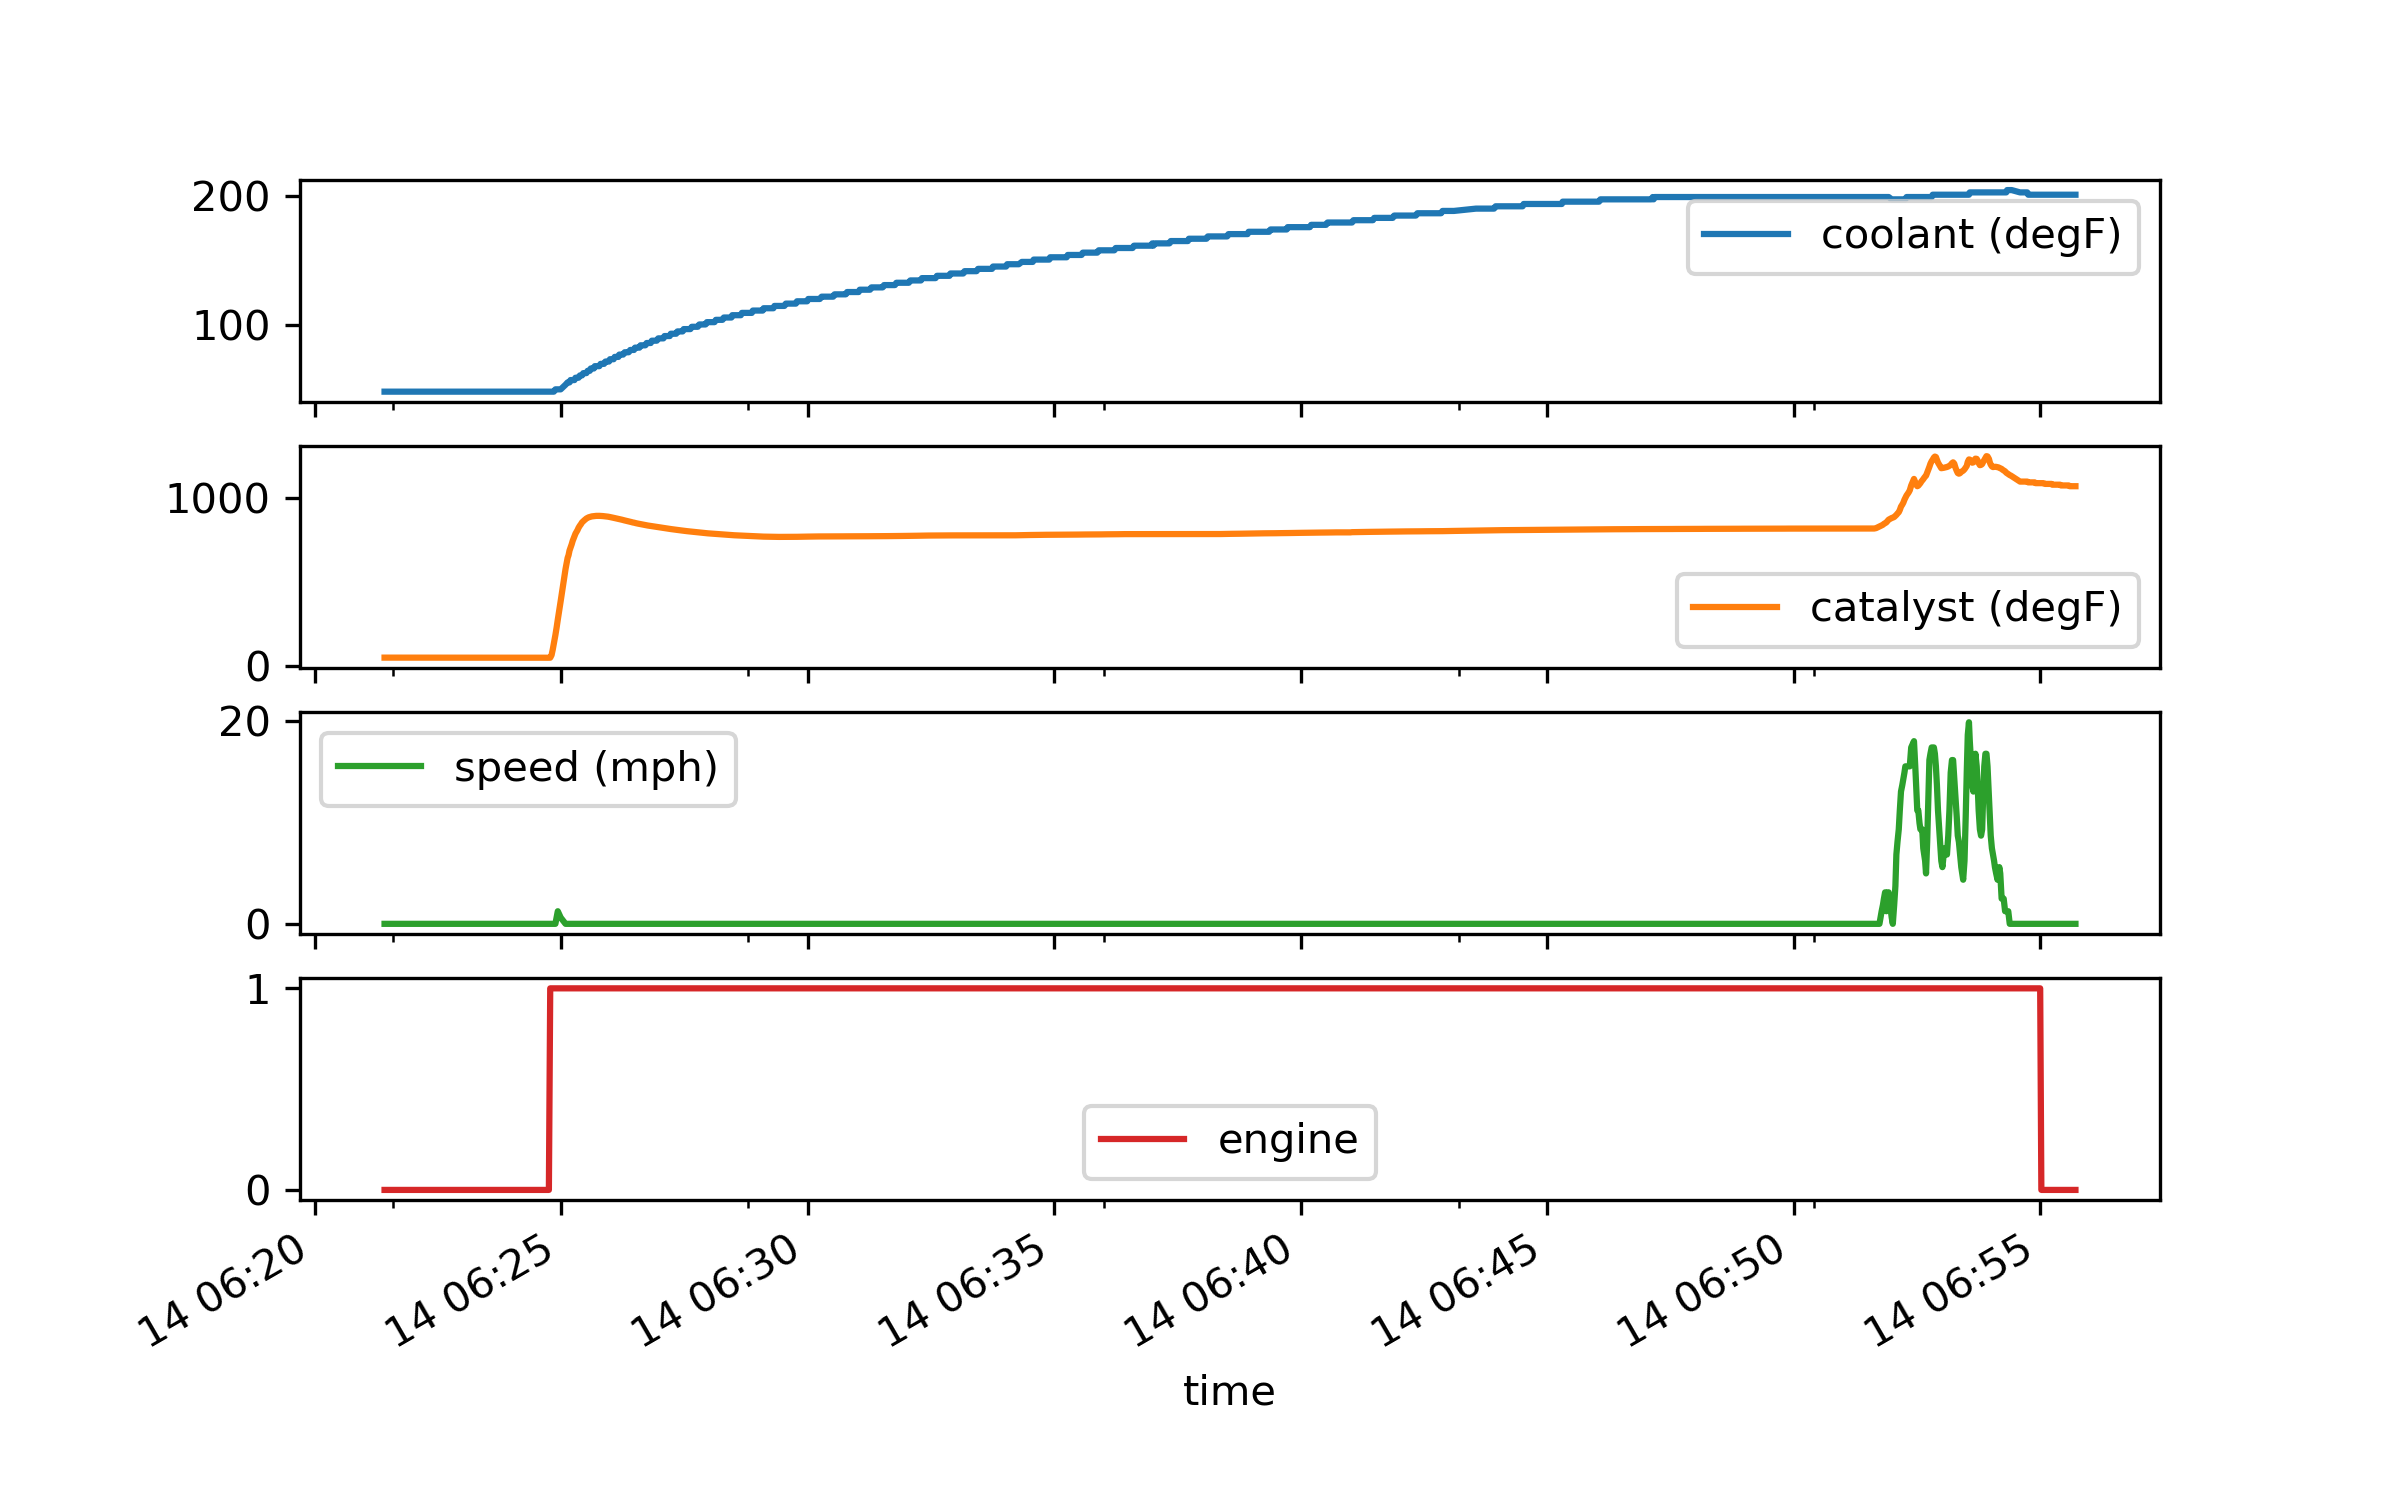
Calculate the time to catalyst light-off (500 degF) in seconds. Create an ARX model of the catalytic temperature and coolant temperature based on the vehicle speed and engine status.
Case Study 2: GIS Map Visualization
Geographic Information Systems (GIS) are used to create, manage, analyze, and map data. GPS is used to identify the location of the vehicle. Car data is merged with location data in a single data file.
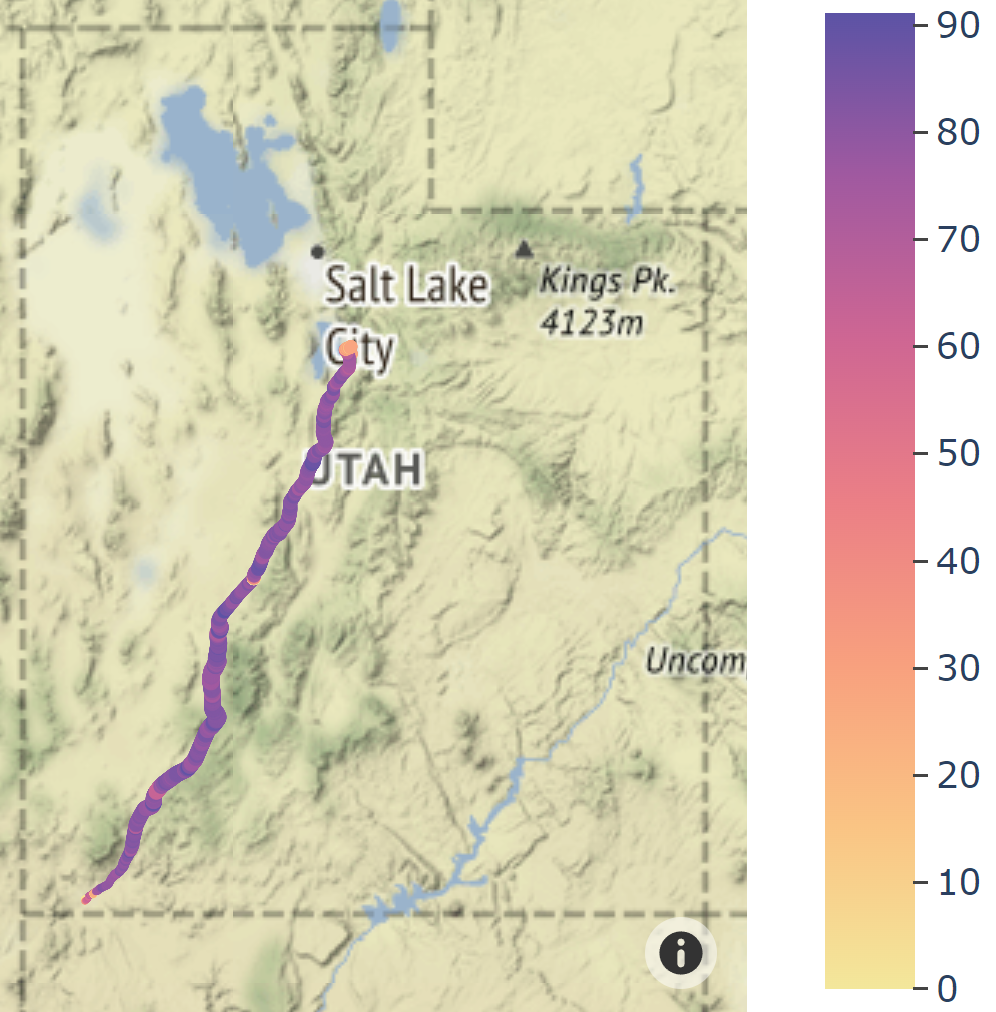
This exercise demonstrates mapping capabilities in Python with three options to create a map and display speed and elevation on the map.
Case Study 3: Fuel Efficiency Regression
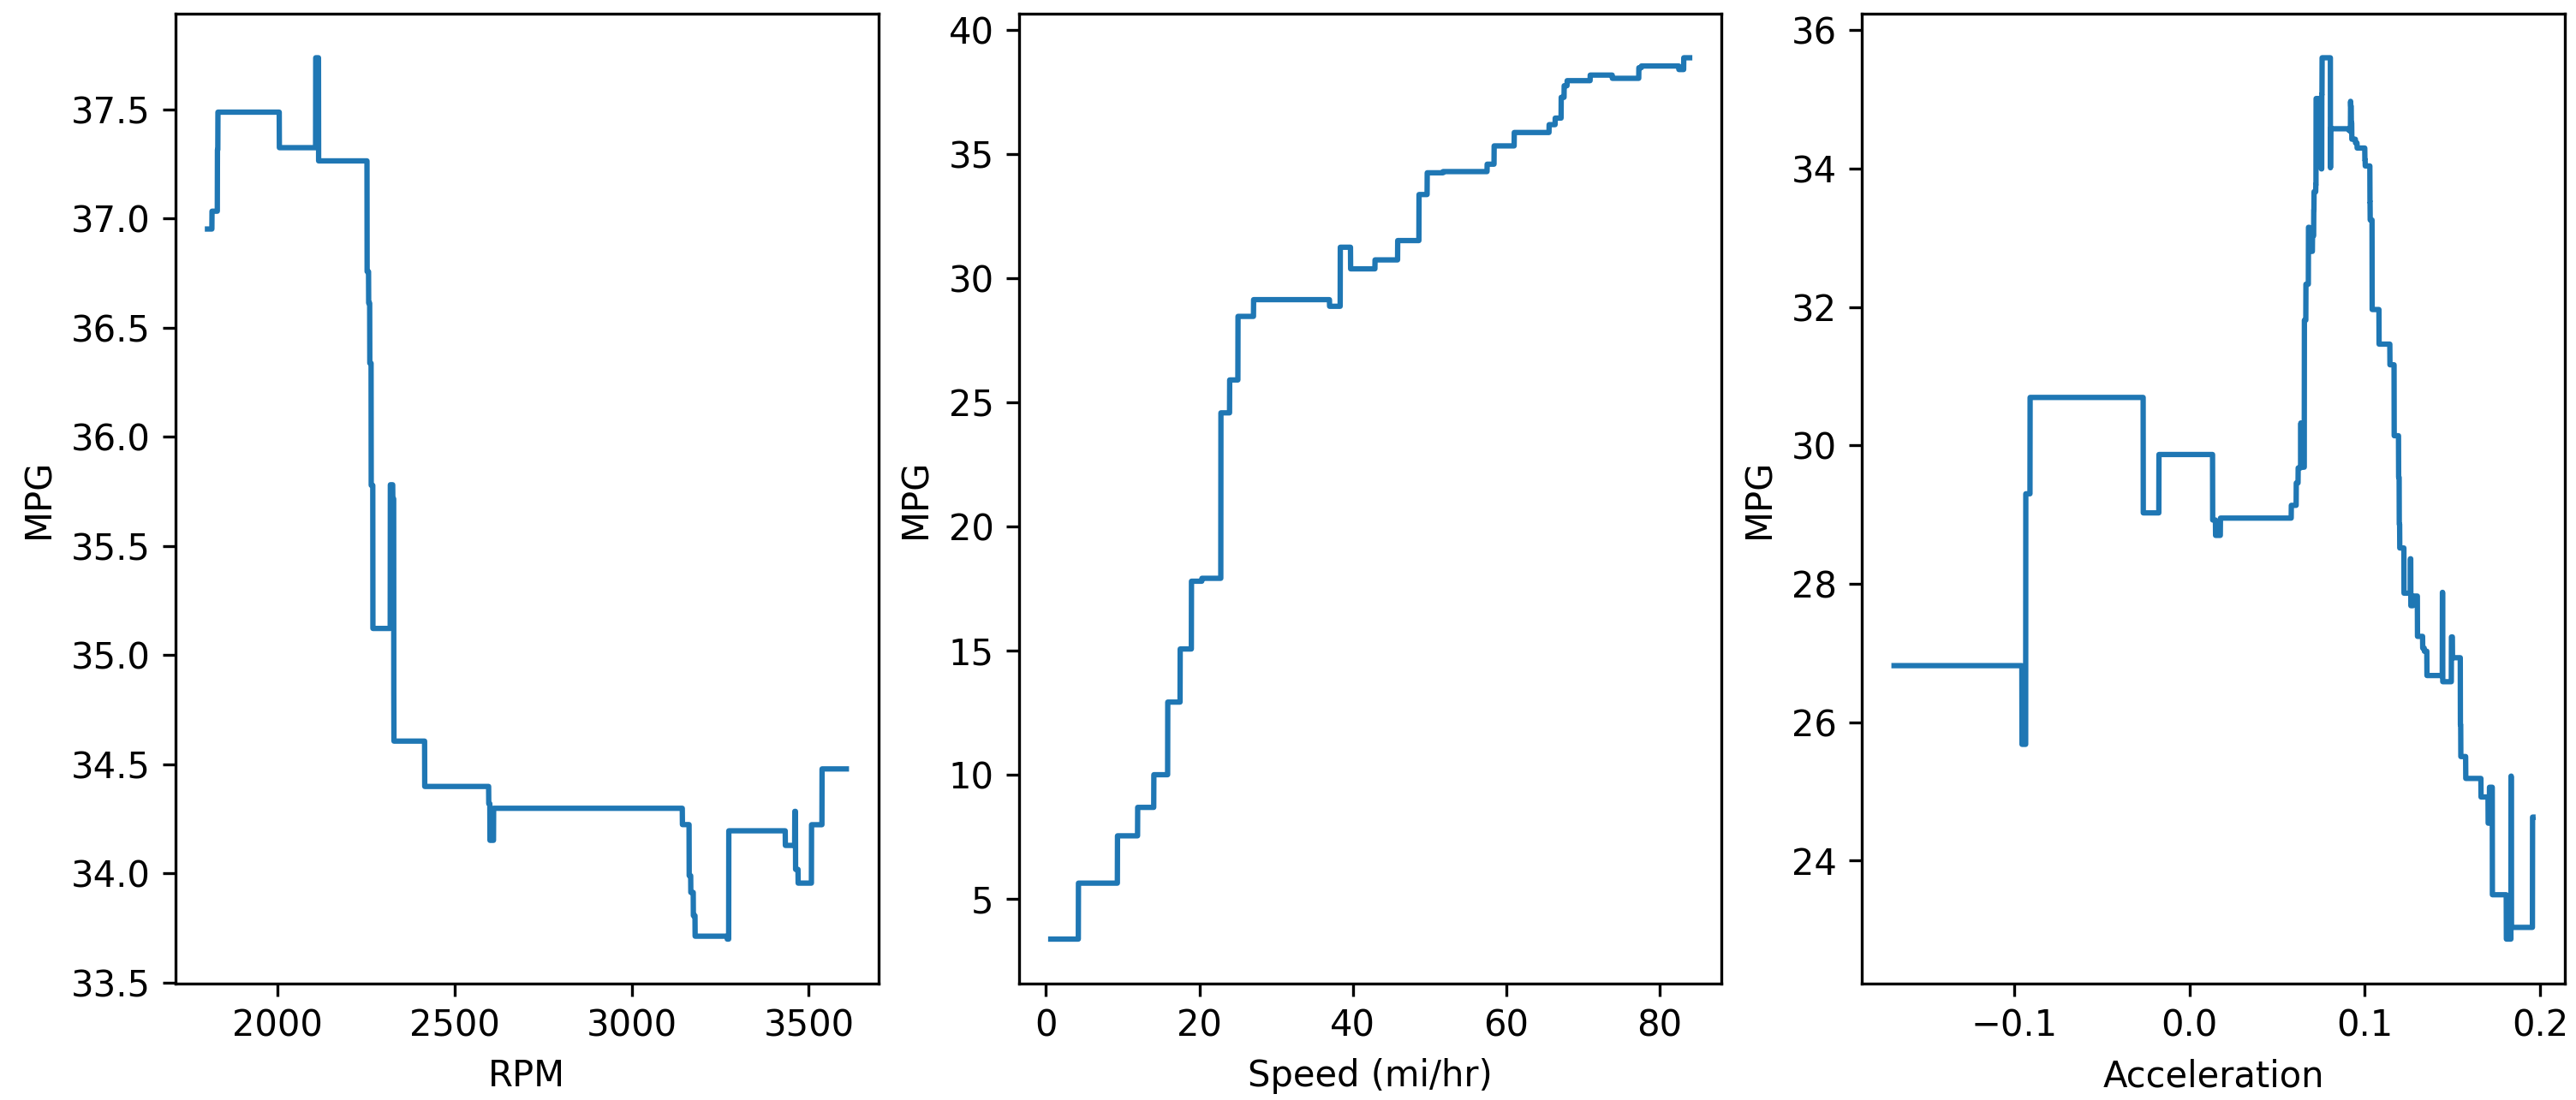
Fuel efficiency is affected by many factors such as speed, elevation changes, and aggressive acceleration. Calculate the fuel efficiency in miles per gallon (MPG) or Liters per 100 km (L/100 km). Use regression to develop a model of how measured factors relate to the fuel efficiency.
Solutions


Generative AI Learning
Use these prompts to test your understanding after completing the exercise. Direct the AI - do not let it do the analysis for you.
Prompt planning: For the map and time-series visualizations, plan the prompt with the Agentic Visualization builder - specify the data source (OBD-II CSV), the message (when and where light-off occurs on the route), and the audience before asking for code.
What to Turn In
Submit a short report (PDF, 1-2 pages) that curates your results into a demonstration of what you learned. You may use Generative AI to help write the report and draft the code, but you must guide it to the correct visualizations, justifications, and assumptions. Answer these questions:
- What is the time to catalyst light-off (500 degF) in seconds for the assigned data set? Include the temperature plot with the light-off point and the engine-start time marked.
- Include your ARX model: structure, inputs, fit plot on training data, and validation on a separate trip or time window. Report a quantitative fit metric for both.
- Does the catalyst warm-up behave like a first-order response? Estimate an approximate time constant from the data and state what physical effects the simple picture misses.
- From the prediction prompt: which of your cold-start/driver/hybrid predictions was wrong or unverifiable, and what would you add to the data collection to answer it?
- One claim or code snippet the AI produced that you corrected or verified, with the evidence.
Generative AI Learning
Use these prompts to test your understanding after completing the case studies. Direct the AI — you own the data analysis and the model. (If you arrived here from Process Dynamics and Control for the Catalytic Converter Light-off assignment, apply the prompts to Case Study 1.)
Tip: The 62-channel OBD-II dataset rewards curiosity beyond the three case studies — air-fuel ratio during acceleration, oxygen sensor switching, elevation vs fuel flow. Pick one extra channel, form a hypothesis before plotting, and check it. Modern vehicle fleets run exactly this kind of monitoring continuously; the skill scales.
What to Turn In
Submit a short report (PDF, 1-2 pages) that curates your results into a demonstration of what you learned. You may use Generative AI to help write the report, but you must guide it to the correct visualizations, justifications, and assumptions. Answer these questions:
- Report the time to catalyst light-off (500 degF) in seconds, with the plot and the exact criterion you used to detect it (first crossing, sustained crossing, interpolation between samples).
- Include your ARX validation: predicted vs measured catalyst temperature on a segment not used for fitting, with the error quantified. Is the model good enough to predict light-off from a speed profile alone?
- Include the speed vs fuel economy analysis: at what speed is this vehicle most efficient, and what physical effects explain the falloff on each side?
- From the ARX interrogation prompt: what steady-state gain does your model imply, and did it survive the physical sanity check?