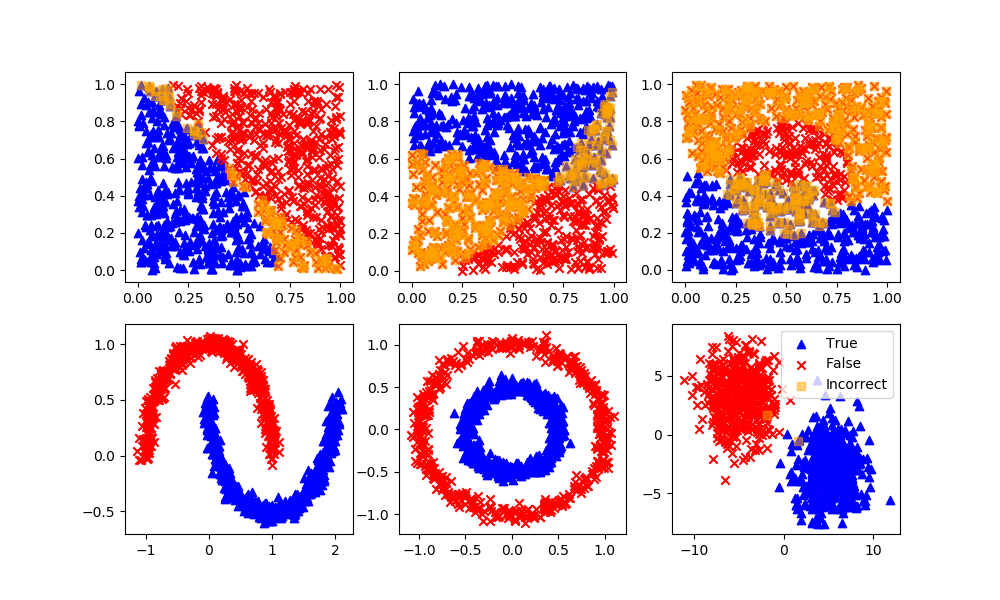
Spectral Clustering
Spectral clustering is a type of unsupervised machine learning algorithm that is used to identify clusters within a dataset. It is a variant of K-means clustering that uses the eigenvectors of a similarity matrix to perform dimensionality reduction before applying K-means. This can be useful when the data is not linearly separable or when the clusters have non-convex shapes.
The spectral clustering algorithm has the following steps:
- Calculate the similarity matrix S of the data points. This matrix is typically constructed using a kernel function, such as the Gaussian kernel, which measures the similarity between each pair of data points.The similarity matrix S is:
$$S_{ij} = k(x_i, x_j)$$
- Compute the degree matrix D of the similarity matrix. The degree matrix is a diagonal matrix that contains the sum of the elements in each row of the similarity matrix. The degree matrix D is:
$$D_{ii} = \sum_{j=1}^{n} S_{ij}$$
- Determine the Laplacian matrix L of the similarity matrix. The Laplacian matrix L is:
$$L = D - S$$
- Compute the eigenvectors of the Laplacian matrix. These eigenvectors, which are also known as the spectral embedding of the data, can be used to perform dimensionality reduction on the data.
- Apply K-means clustering on the spectral embedding of the data to identify clusters within the data. The eigenvectors of the Laplacian matrix can be computed by solving the following eigenvalue problem:
$$L v_i = \lambda_i v_i$$
Once the eigenvectors have been computed, they can be used to perform dimensionality reduction on the data by projecting the data points onto the eigenvectors with the largest eigenvalues. This reduced-dimensional representation of the data can then be used as input to K-means clustering to identify clusters within the data.
Spectral clustering is known as segmentation-based object categorization. It is a technique with roots in graph theory, where identify communities of nodes in a graph are based on the edges connecting them. The method is flexible and allows clustering of non graph data as well. It uses information from the eigenvalues of special matrices built from the graph or the data set.
Advantages: Flexible approach for finding clusters when data doesn’t meet the requirements of other common algorithms.
Disadvantages: For large-sized graphs, the second eigenvalue of the (normalized) graph Laplacian matrix is often ill-conditioned, leading to slow convergence of iterative eigenvalue solvers. Spectral clustering is computationally expensive unless the graph is sparse and the similarity matrix can be efficiently constructed.
sc = SpectralClustering(n_clusters=2,eigen_solver='arpack',\
affinity='nearest_neighbors')
yP = sc.fit_predict(XB) # No separation between fit and predict calls
# Need to fit and predict on same dataset
# Arbitrary labels with unsupervised clustering may need to be reversed
if len(XB[yP!=yB]) > n/4: yP = 1 - yP

MATLAB Live Script
✅ Knowledge Check
1. How is the similarity matrix S constructed in spectral clustering?
- Incorrect. The similarity matrix S is constructed using a kernel function, like the Gaussian kernel, to measure the similarity between pairs of data points.
- Incorrect. While Euclidean distance can be used in some kernel functions, the similarity matrix S is specifically defined in terms of a kernel function.
- Correct. The similarity matrix S is constructed using a kernel function to measure the similarity between data points.
- Incorrect. The similarity matrix S is not constructed based on absolute differences; it uses a kernel function.
2. Why is spectral clustering particularly useful in certain datasets?
- Incorrect. One of the strengths of spectral clustering is its ability to handle data that is not linearly separable or has non-convex shapes.
- Incorrect. Spectral clustering is useful especially when clusters have non-convex shapes.
- Correct. Spectral clustering uses eigenvectors of the similarity matrix to perform dimensionality reduction, which can capture complex cluster structures, including non-convex ones.
- Incorrect. Spectral clustering can be computationally expensive, especially for large graphs or when the similarity matrix is dense.
Return to Classification Overview

