Additive Manufacturing
Additive manufacturing is the process of building from a computer controlled 3-dimensional printer. The material can be polymer (plastic), ceramic, metallic powder, liquid, or any material that is joined together through deposition, solidification, or fusion. It speeds the development of prototypes by precisely converting a computer aided design (CAD) drawing into a physical device. Additive manufacturing can be either a prototype or scaled up to full product production, but typically for applications that require customization or with low production volumes.
| Background: A 3D print data set of additive manufacturing test conditions is available for Polylactic Acid (PLA) and Acrylonitrile Butadiene Styrene (ABS). PLA can print at lower temperatures of 180°C compared to 250°C for ABS. PLA is more brittle than ABS and is not typically suitable for high strength applications. The data was collected by researchers in the Mechanical Engineering department at Selçuk Üniversitesi on a Ultimaker S5 3D printer. The study focused on how the parameters in a specific 3D printer affects the print quality, accuracy and final part strength. This work is based on the settings and PLA or ABS filaments. Material and strength tests were carried out on a Sincotec GMBH tester capable of pulling 20 kN. | 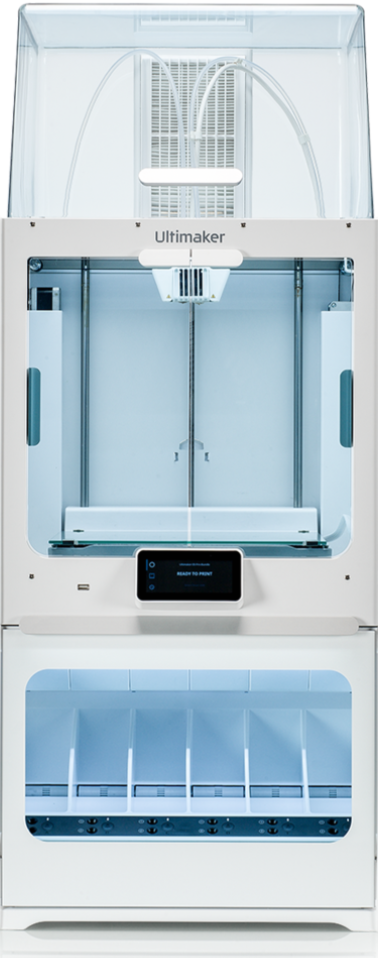 |
Nine parameters were adjusted for the Ultimaker S5 3D printer.
- Layer Height (mm)
- Wall Thickness (mm)
- Infill Density (%)
- Infill Pattern (Honeycomb or Grid)
- Nozzle Temperature (ºC)
- Bed Temperature (ºC)
- Print Speed (mm/s)
- Material (PLA or ABS)
- Fan Speed (%)
After the part was manufactured, three parameters were measured for each product.
- Roughness (µm)
- Tension Strength (MPa)
- Elongation (%)
The labeled data is a combination of PLA and ABS material, print patterns, and conditions with 66 samples from a first repository and 50 samples from a second repository. The combined set is 70 samples with the duplicates removed and one outlier added. The label associated with each filament is pla or abs. The print pattern is grid or honeycomb. One-hot encoding translates character labels into a binary representation (0 or 1) for classification.
import pandas as pd
url = 'http://apmonitor.com/pds/uploads/Main/manufacturing.txt'
data = pd.read_csv(url)
# 'material' (1 is abs, 0 is pla) with numpy.where
data['material'] = np.where(data['material']=='abs',1,0)
# 'infill pattern' (1 is 'grid', 0 is 'honeycomb') with list comprehension
data.infill_pattern = [1 if ip=="grid" else 0 for ip in data.infill_pattern]



Part 1: Data Visualization and Cleansing
Generate summary statistics with a profiling report to statistically characterize the data. Use box plots to identify the one outlier in the data. Remove the row that contains the outlier from the data set. Generate a pair plot and correlation matrix. What factors are highly correlated to Material (PLA or ABS) and Tension Strength (MPa)?
Part 2: Classification of Materials
Train and test a classifier to distinguish between PLA and ABS filament material. Test at least 8 classifiers of your choice. Recommend a best classifier among the 8 that are tested. Randomly select values that split the data into a train (80%) and test (20%) set by using the sklearn train_test_split with shuffle=True.
Report the confusion matrix on the test set for each classifier. Discuss the performance of each. A confusion matrix shows true positive, false positive, true negative, and false negative groups from the test set. Generate a confusion matrix for each classifier.
Test 8 classification methods. Possible classification methods are:
- Adaptive Boosting (AdaBoost)
- Logistic Regression
- Naïve Bayes
- Stochastic Gradient Descent
- K-Nearest Neighbors
- Decision Tree
- Random Forest
- Support Vector Classifier
- Deep Learning Neural Network
- XGBoost Classifier
Part 3: Regression
Develop a regression model to predict Tension Strength (MPa) using the 9 machine settings.
- Layer Height (mm)
- Wall Thickness (mm)
- Infill Density (%)
- Infill Pattern (Honeycomb or Grid)
- Nozzle Temperature (ºC)
- Bed Temperature (ºC)
- Print Speed (mm/s)
- Material (PLA or ABS)
- Fan Speed (%)
Report the correlation coefficient (R2) for the train and test sets. Randomly select values that split the data into a train (80%) and test (20%) set. Use Linear Regression, Neural Network (Deep Learning), and another regression method of your choice. Discuss the performance of each.
Regression: Use 3 regression methods. Possible regression methods are:
- Linear Regression
- Neural Network (Deep Learning)
- K-Nearest Neighbors
- Support Vector Regressor
- XGBoost Regressor
There is concern that PLA has less strength than ABS for additive manufacturing. Compare the PLA and ABS predicted strength for all of the test points. One way to compare the strength is to change the PLA material to ABS and recalculate the predicted Tension Strength (MPa).
Summary Report
Submit source code and an executive summary memo (max 2 pages) of the results from Parts 1-3.
- What is the outlier data row?
- What are the correlated variables with Material and Strength?
- What is the ability of the classifier to predict PLA or ABS print material?
- What is the relative strength of PLA versus ABS?
References
- Wang, C., Tan, X.P., Tor, S.B. and Lim, C.S., Machine learning in additive manufacturing: State-of-the-art and perspectives. Additive Manufacturing, 2020, p.101538.
- What is additive manufacturing?, GE Additive, YouTube, Posted Online July 2020.
- Minshall, T., How 3D printing is enabling the 4th Industrial Revolution, YouTube, Hosted by TEDxOxBridge, Posted Online June 2016.
- Alvarado, T., Introducing the Future of Manufacturing, YouTube, Hosted by TEDxCoeurdalene, Posted Online May 2019.
- Nomula, V.K., 3D Printer Material Dataset, Kaggle, Data Archive.
- Okudan, A., 3D Printer Dataset for Mechanical Engineers, Dataset for find relations between the input parameters of 3D printers, Kaggle, Data Archive.
Generative AI Learning
Use these prompts to test your understanding after completing the case study. Direct the AI — with 70 samples, every judgment call is yours.
Tip: This case study is the template for the midterm exam's applied section — practice writing the memo as if a manufacturing engineer who has never seen scikit-learn will read it and choose print settings based on your conclusions.
What to Turn In
Submit your source code and an executive memo (PDF, maximum 2 pages) that curates your results into a demonstration of what you learned. You may use Generative AI to help write the memo, but you must guide it to the correct visualizations, justifications, and assumptions. Answer these questions:
- Data preparation: the profiling/box-plot evidence you used, what you cleansed or encoded, and the final feature table.
- Classification: the 8+ classifier comparison with test confusion matrices, and which classifier you would trust to identify material type — justified by more than accuracy.
- Regression: three models for tension strength with parity plots, and your PLA vs ABS strength conclusion WITH an honest statement of uncertainty given n=70.
- From the synthetic-data debate: your decision, your strongest argument for it, and the strongest argument against it.
- From the quiz prompt: one question you missed and the corrected answer.