Feature Engineering
Feature engineering is the process of selecting and creating the input descriptors for machine learning. Categorical data is converted to numeric values such as True=1 and False=0. Encoding creates indicators from images, words, numbers, or discrete categories.
- Ordinal Encoding: assign number to each option (e.g. 0=red, 1=blue)
- One-Hot Encoding: new binary (0 or 1) feature for each option
- Feature Hashing: compromise between ordinal and one-hot encoding
Feature generation may also create new data columns that are derived from the existing features. This may include a nonlinear transform of an individual feature or a product of two features.

Selection and creation of features is an important step in machine learning. Too many features may cause the classifier or regressor to increase the chances of predicting poorly. With many features, one of the inputs may be a bad value and cause a bad prediction. More features also take longer for data curation, training, and prediction. There are methods to rank the most important features for classification or regression.
There are methods to rank features in order of significance such as SHAP (SHapley Additive exPlanations). SHAP gives each feature a ranking to explain the output of a machine learning model or SelectKBest to rank the input features. Unimportant features are identified and removed to improve training time, reduce storage cost, and minimize deployment resources.
Data Transformation

Data transformation is the modification of a data column to create a modified feature.
Nonlinear Transform
A common example of data transformation is to perform a nonlinear transform such as log-scale of time.
import pandas as pd
data = pd.read_csv('http://apmonitor.com/pds/uploads/Main/tclab_data6.txt')
data['log_time'] = np.log(data['Time'].values)
data.head()
     Time   Q1   Q2     T1     T2  log_time
  0   0.0  0.0  0.0  16.06  16.00      -inf
  1   1.0  0.0  0.0  16.06  15.97  0.000000
  2   2.0  0.0  0.0  16.06  16.03  0.693147
  3   3.0  0.0  0.0  16.03  16.00  1.098612
  4   4.0  0.0  0.0  16.03  15.94  1.386294
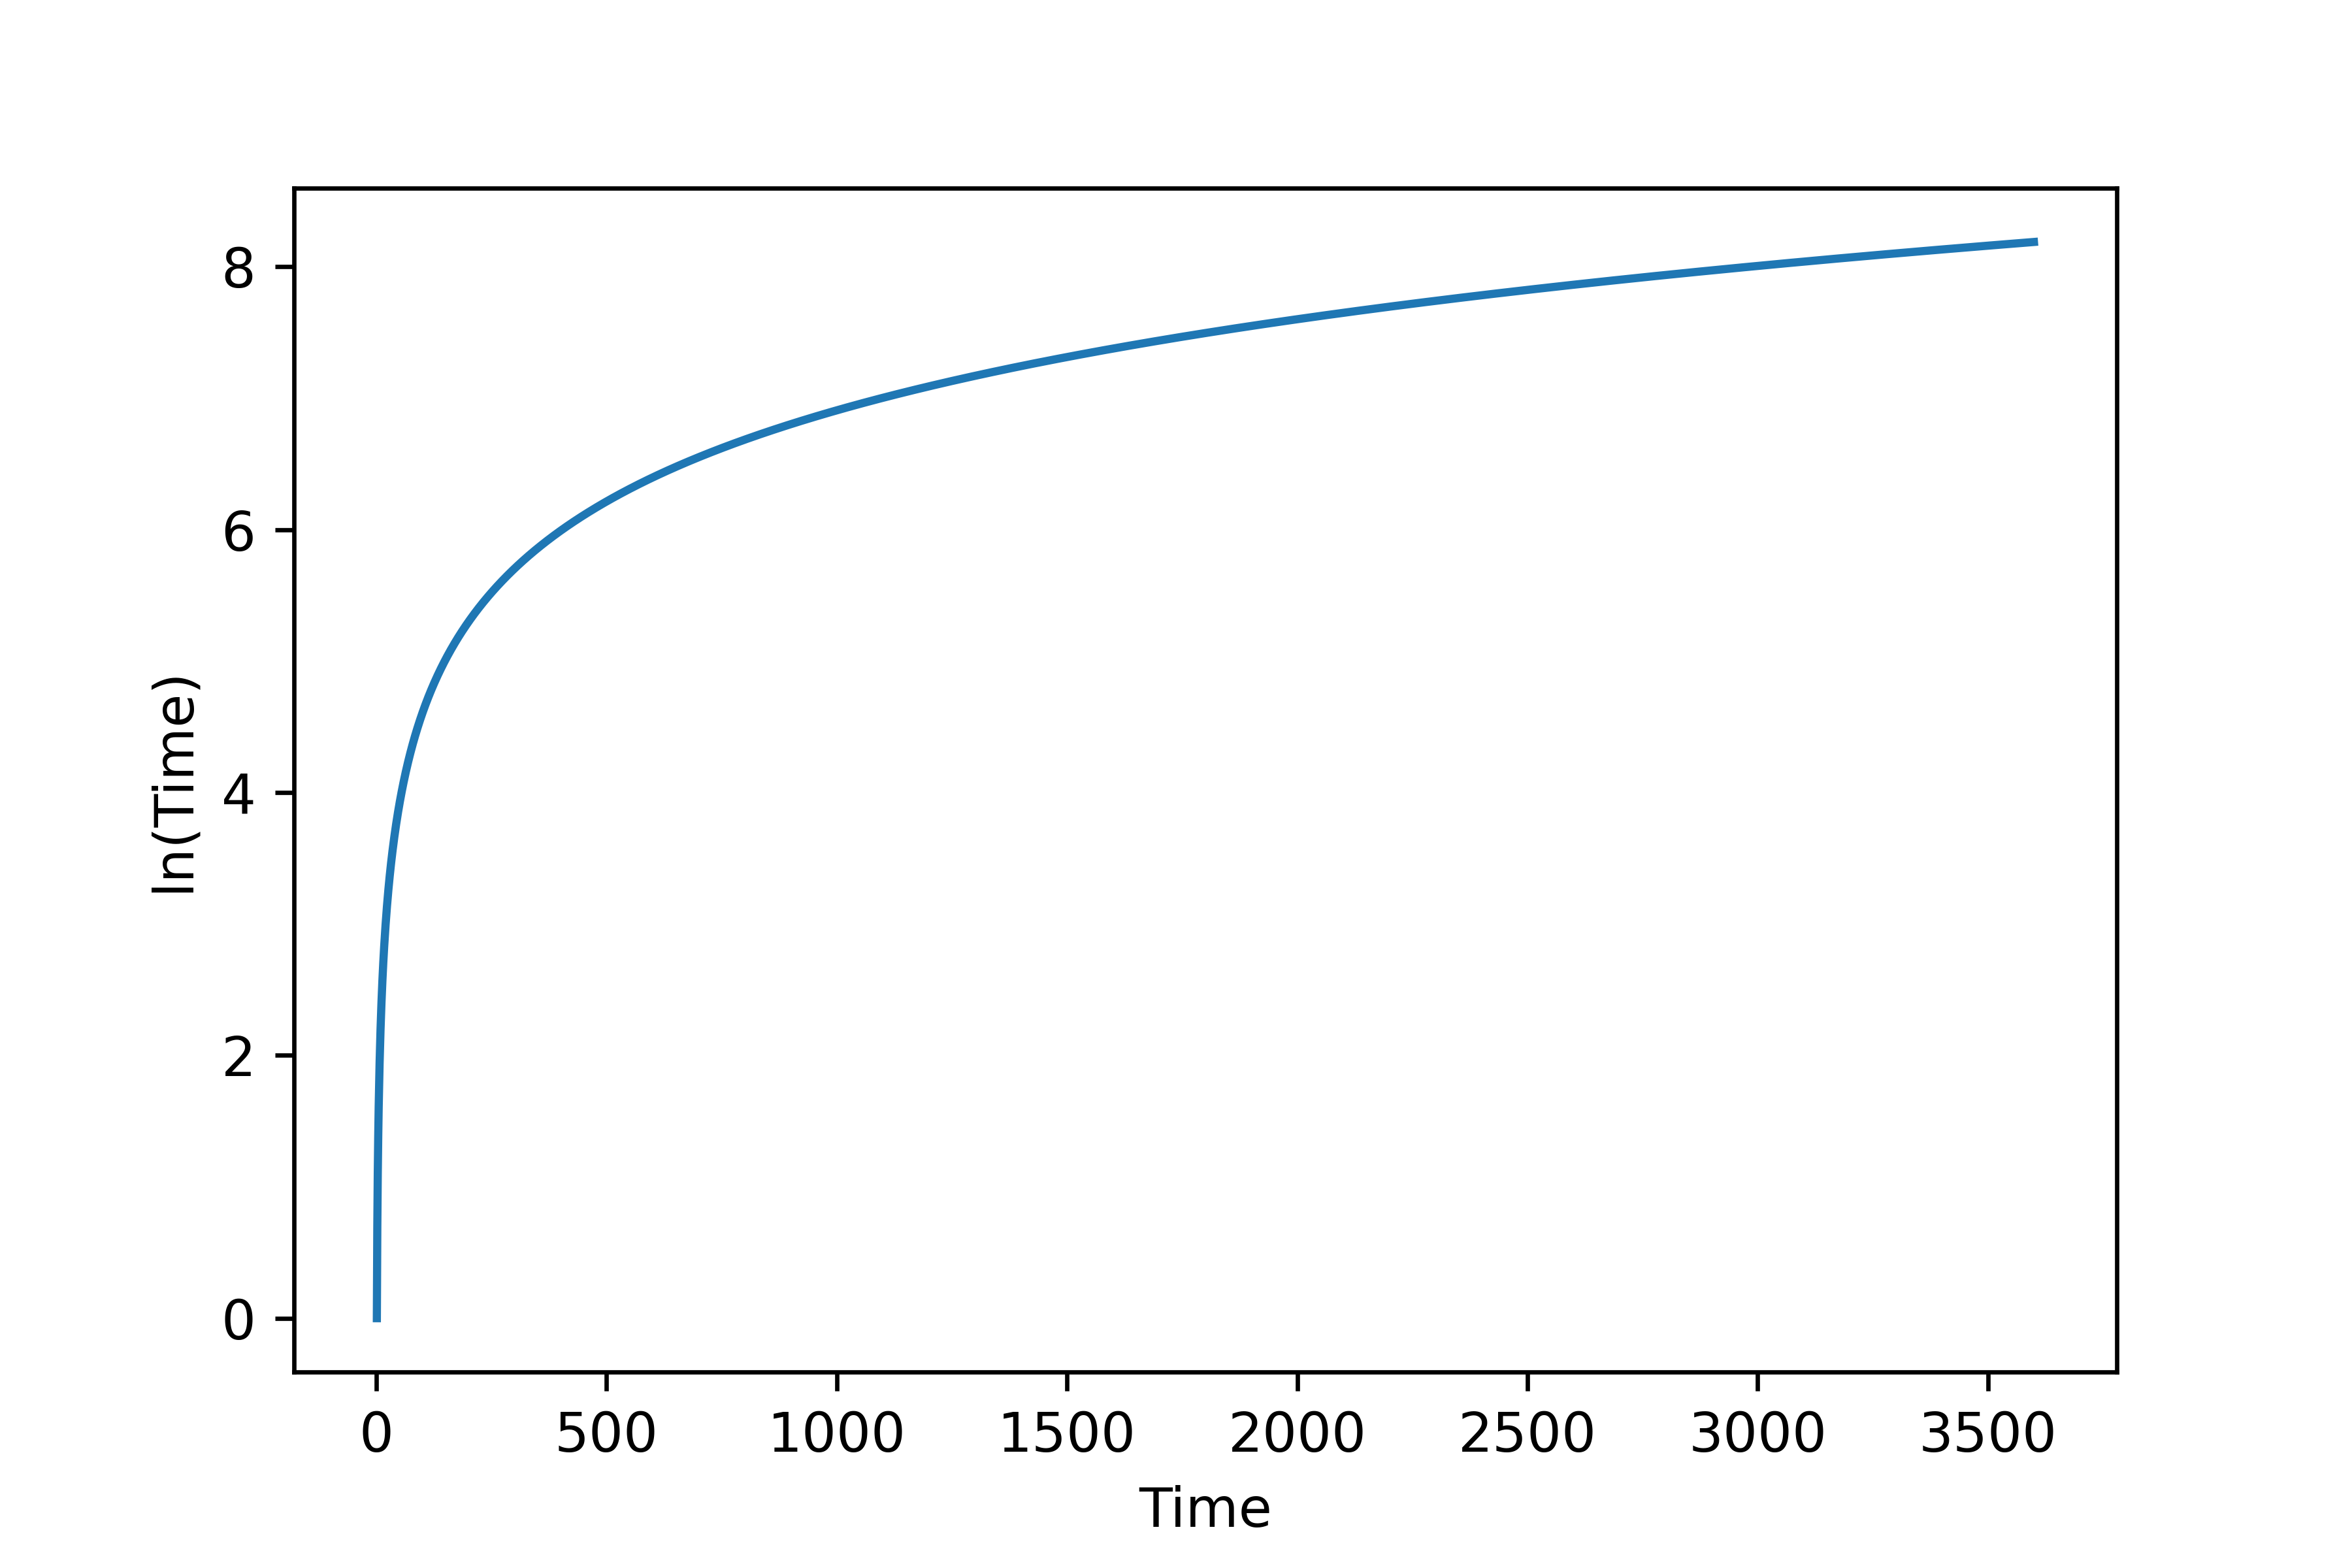
data['log_time'].plot()
Statistical Transform
Statistical measures are another example of data transformations. A rolling window of the mean, standard deviation, kurtosis, skew, or other statistical information may give additional features for classification or regression.
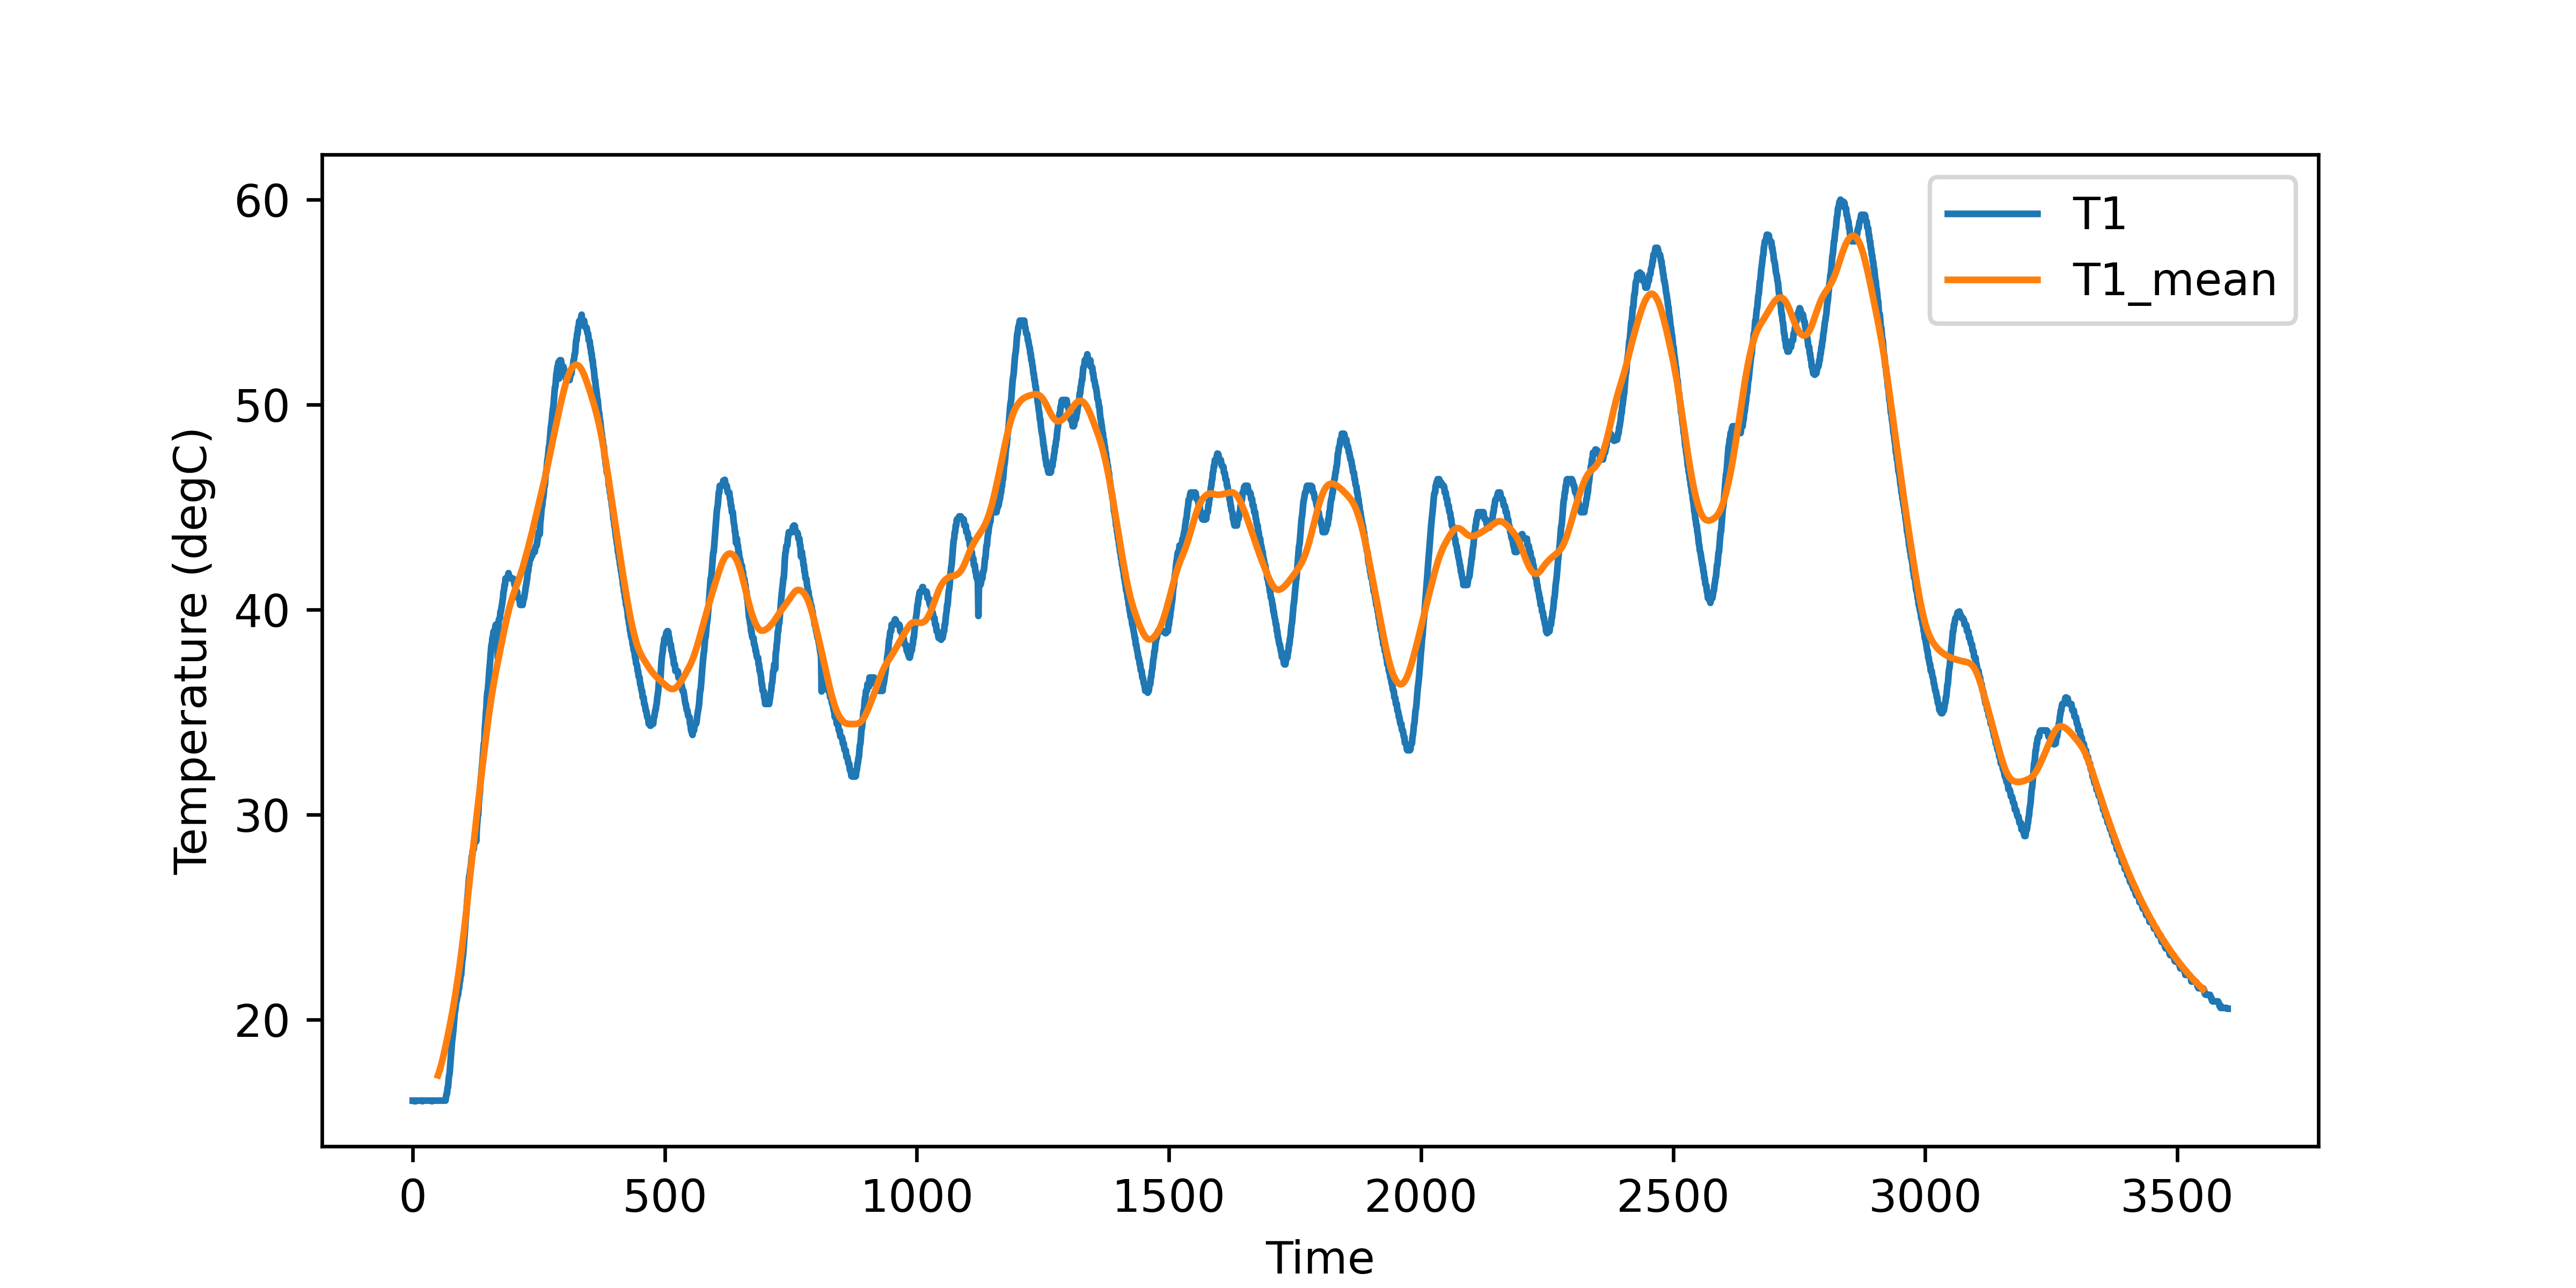
data['T1_stdev'] = data['T1'].rolling(window=100,center=True).std()
data['T1_skew'] = data['T1'].rolling(window=100,center=True).skew()
data[['T1','T1_mean']].plot(figsize=(8,4),ylabel='Temperature (degC)')
Categorical Data
Categorical data takes a limited number of discrete values and are typically represented as strings. An example of categorical data is the classification of cats and dogs based on weight and color.

url = 'http://apmonitor.com/pds/uploads/Main/animals.txt'
data = pd.read_csv(url)
data.head()
  Weight Color   Type
   0.35  Gray    Cat
   0.52  White   Dog
   0.73  White   Dog
   1.2   Orange  Cat
   1.3   Gray    Cat
   1.4   Orange  Cat
   2.2   Brown   Dog
   2.3   White   Cat
   3.0   Gray    Dog
   4.5   Brown   Dog
   8.3   White   Dog
  18.2   Orange  Dog
  24.4   Tan     Dog
  29.3   Orange  Dog
  42.6   Tan     Dog
 220.0   Orange  Cat
The output label is Cat or Dog but most machine learning algorithms need the data as a numerical value as 0 or 1. This can be accomplished for the output label with a map.
data['Label'] = data['Type'].replace(mapping)
     Weight   Color Type  Label
  0    0.35    Gray  Cat      0
  1    0.52   White  Dog      1
  2    0.73   White  Dog      1
  3    1.20  Orange  Cat      0
  4    1.30    Gray  Cat      0
The color feature of the animal is transformed with one of 3 methods:
- Ordinal Encoding
- One-Hot Encoding
- Feature Hashing
1. Ordinal Encoding
The simplest method for converting categorical data into a numeric value is to use an ordinal transform to produce CNumber.
  0 = Gray
  1 = White
  2 = Orange
  3 = Brown
  4 = Tan
The disadvantage of this approach is that the numerical feature has an ordered set where there is no significance to the order.
data['CNumber'] = pd.factorize(data['Color'])[0]
      Weight   Color Type  CNumber
  0     0.35    Gray  Cat        0
  1     0.52   White  Dog        1
  2     0.73   White  Dog        1
  3     1.20  Orange  Cat        2
  4     1.30    Gray  Cat        0
  5     1.40  Orange  Cat        2
  6     2.20   Brown  Dog        3
  7     2.30   White  Cat        1
  8     3.00    Gray  Dog        0
  9     4.50   Brown  Dog        3
  10    8.30   White  Dog        1
  11   18.20  Orange  Dog        2
  12   24.40     Tan  Dog        4
  13   29.30  Orange  Dog        2
  14   42.60     Tan  Dog        4
  15  220.00  Orange  Cat        2
2. One-Hot Encoding
When there are fewer than 15 categories, one-hot encoding is a viable option to transform features into numerical values and avoid problems with ordinal encoding. The pandas function get_dummies performs this transformation. In this case, each color is a new feature with a 0 or 1 for the color.
data.head()
     Weight   Color Type  Brown  Gray  Orange  Tan  White
  0    0.35    Gray  Cat      0     1       0    0      0
  1    0.52   White  Dog      0     0       0    0      1
  2    0.73   White  Dog      0     0       0    0      1
  3    1.20  Orange  Cat      0     0       1    0      0
  4    1.30    Gray  Cat      0     1       0    0      0
This also allows multiple colors to be represented as features, possibly with a fractional value for the surface area of the color.
3. Feature Hashing
Feature hashing is a compromise between ordinal encoding and one-hot encoding. It is encoding into a non-binary vector with a specified number of new features. In this example, 2 new features Color_0 and Color_1 are created.
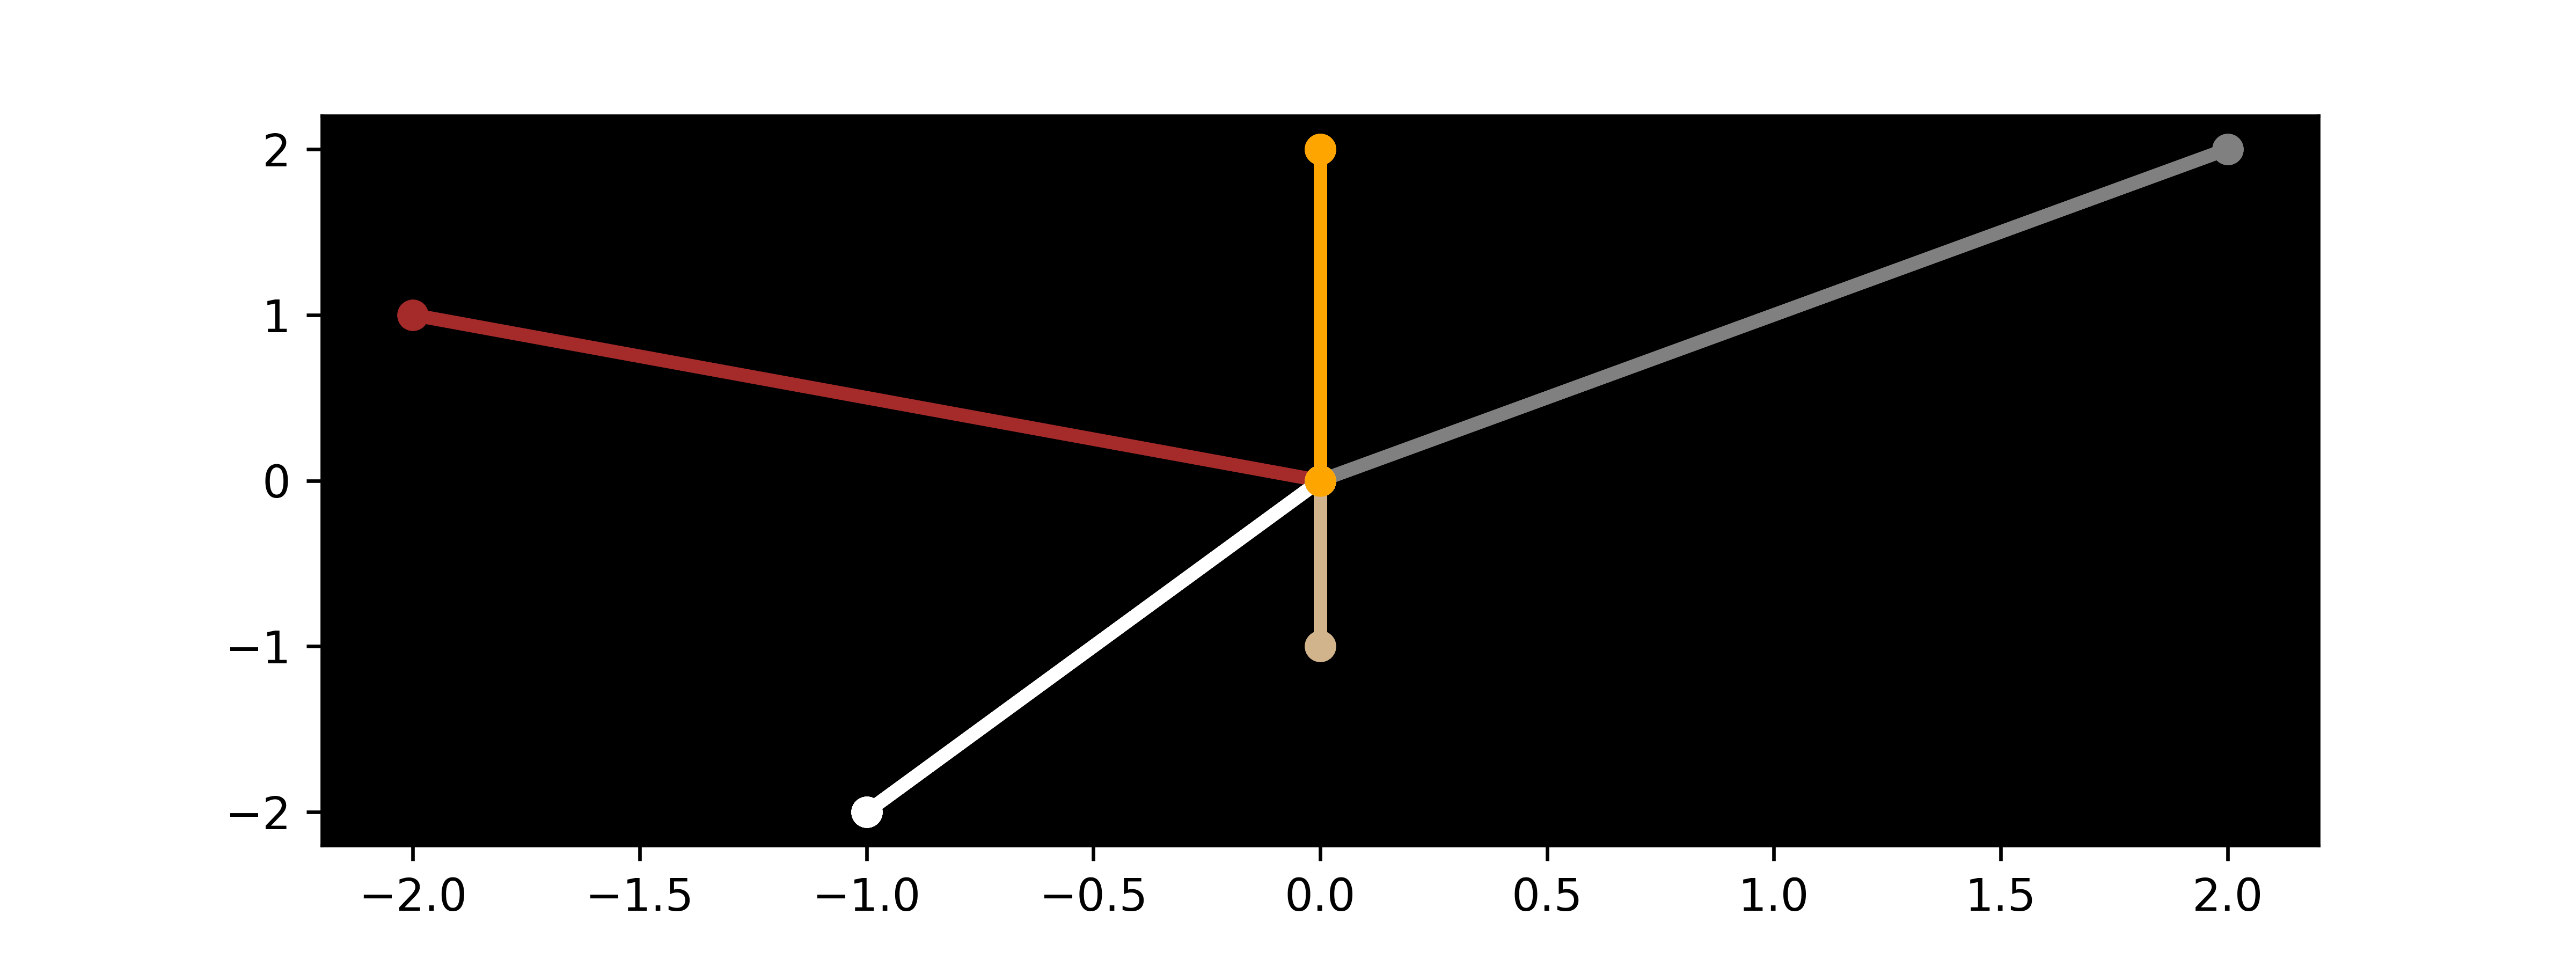
fh = FeatureHasher(n_features=2, input_type='string')
ht = fh.fit_transform(data['Color'].apply(lambda x: [x])).toarray()
nc = pd.DataFrame(ht)
nc.columns = ['Color_'+str(i) for i in range(fh.n_features)]
data = data.join(nc)
print(data.head())
# create plot to show new features
import matplotlib.pyplot as plt
plt.figure(figsize=(8,3))
plt.rcParams['axes.facecolor'] = 'black'
for i in range(len(data)):
plt.plot([0,data['Color_0'][i]],\
[0,data['Color_1'][i]],\
color=data['Color'][i],\
marker='o',linestyle='-',lw=3)
plt.show()
     Weight   Color Type  Label  Color_0  Color_1
  0    0.35    Gray  Cat      0      2.0      2.0
  1    0.52   White  Dog      1     -1.0     -2.0
  2    0.73   White  Dog      1     -1.0     -2.0
  3    1.20  Orange  Cat      0      0.0      2.0
  4    1.30    Gray  Cat      0      2.0      2.0
Feature Collection and Generation
Data aggregation imports new features from a combination of data sources. Python packages such as Feature Tools assist in automating the generation and curation of derived features. When a tool such as Feature Tools generates many new potential features, it is important to retain only the best set of features for training and testing.
Feature Selection
Features should be removed if it is a single constant value, there is a large imbalance of categories, or if there is little correlation to the output label. There are statistical tests to select features that strong relationships with the output label. A tool is SelectKBest with associated statistical tests. This method uses a `\chi^2` statistical test for non-negative features to rank the best features for predicting the output. If there are negative features then a MinMaxScalar can be used to scale all features to 0 to 1.
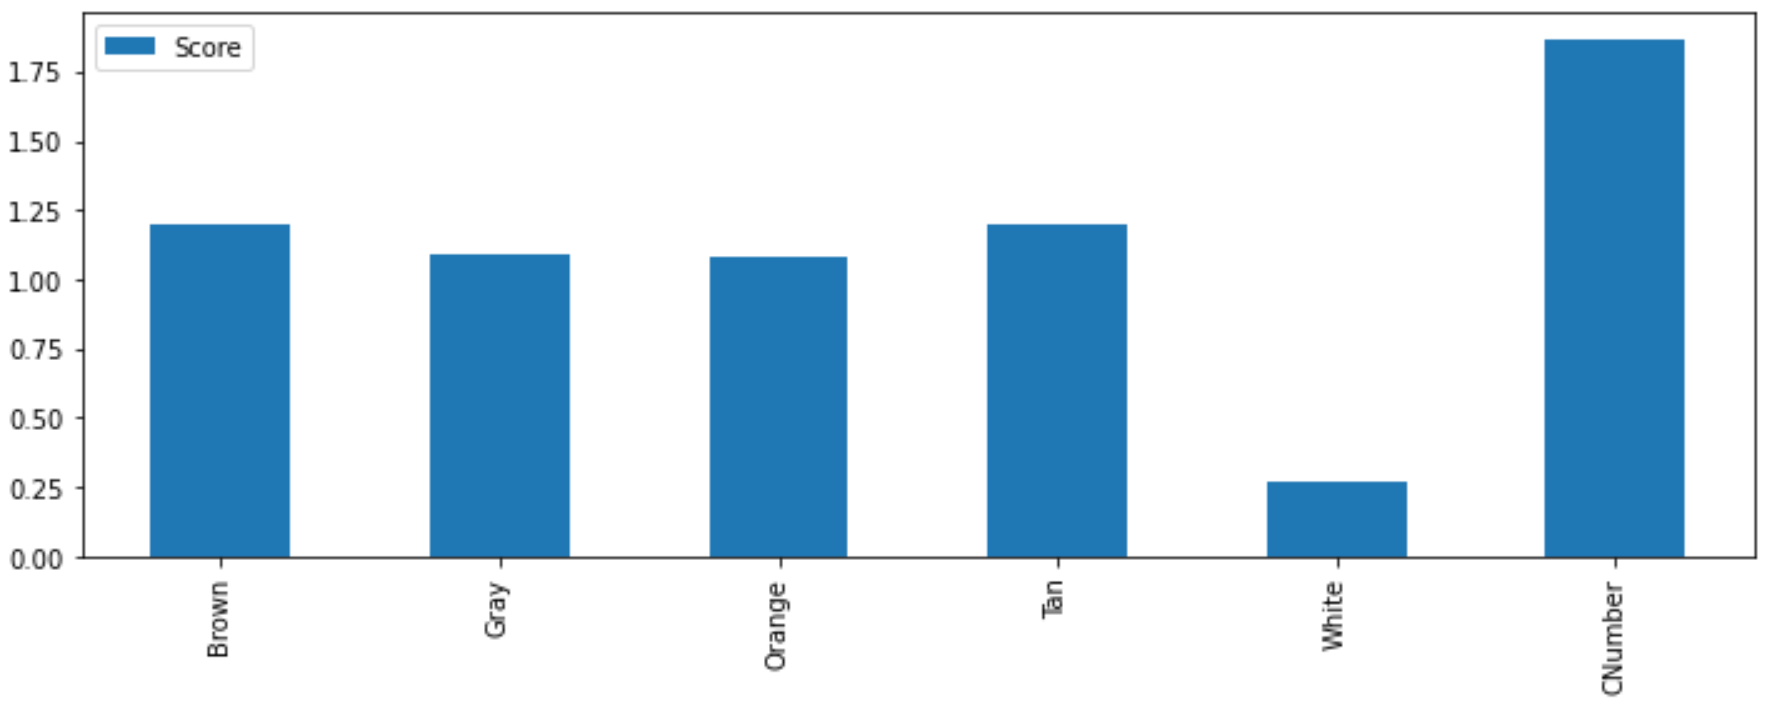
from sklearn.feature_selection import chi2
import matplotlib.pyplot as plt
plt.rcParams['axes.facecolor'] = 'white'
bestfeatures = SelectKBest(score_func=chi2, k='all')
features = ['Brown','Gray','Orange','Tan','White','CNumber']
X = data[features]
y = data['Label']
fit = bestfeatures.fit(X,y)
dfscores = pd.DataFrame(fit.scores_)
dfcolumns = pd.DataFrame(X.columns)
scores = pd.concat([dfcolumns,dfscores],axis=1)
scores.columns = ['Specs','Score']
scores.index = features
scores.plot(kind='bar',figsize=(8,2))
plt.show()
An iterative method is to remove the lowest performing feature and test the goodness of fit after training without the feature. The iterative method continues to remove features until the test score drops.
Exercise 1

The first and second derivatives of the temperature are calculated as features to classify when the TCLab heater is on or off in the case study for equipment health monitoring.
Exercise 2

Physical and chemical properties of the Lithium-ion silicate cathodes predict the crystal structure of a Lithium-ion battery material as monoclinic, orthorhombic and triclinic. This case study demonstrates how feature engineering improves the classification results.

Further Reading
- Banerjee, P., Comprehensive Guide on Feature Selection, Kaggle Notebook, Jan 2021.
- Brownlee, J., An Introduction to Feature Selection, Oct 2014.
- Brownlee, J., Recursive Feature Elimination (RFE) for Feature Selection in Python, May 2020.
- Brownlee, J., How to Calculate Feature Importance With Python, March 2020.
- Koehrsen, W., Automated Feature Engineering in Python, Jun 2018.
- Sarkar, D., Continuous Numeric Data (Part 1) and Categorical Data (Part 2), Jan 2018.

✅ Knowledge Check
1. Which of the following methods is described as a compromise between ordinal encoding and one-hot encoding?
- Incorrect. Feature Tools is a Python package for automating the generation and curation of derived features.
- Correct. Feature hashing is encoding into a non-binary vector with a specified number of new features. It is a compromise between ordinal and one-hot encoding.
- Incorrect. One-Hot Encoding is a method to transform features into numerical values, where each category is a new feature with a 0 or 1 value.
- Incorrect. Ordinal Encoding is a simple method for converting categorical data into a numeric value, producing an ordered set.
2. What is the primary function of the SHAP (SHapley Additive exPlanations)?
- Incorrect. SHAP does not perform a nonlinear transform of data; it ranks the significance of features.
- Incorrect. SHAP is not primarily for generating new features but rather ranking existing ones.
- Correct. SHAP (SHapley Additive exPlanations) gives each feature a ranking to explain the output of a machine learning model. It is a game theoretic approach to explain the output of any machine learning model.
- Incorrect. SHAP is not a method for one-hot encoding. One-hot encoding is a way to transform categorical data into numeric format.


