Polymer Melt Flow Rate
Polymer properties such as density, melt index, and melt flow rate must be kept within tight specifications for each grade. This case study is to analyze polymer production data to predict melt flow rate.


| Background: There are gas phase and liquid slurry reactors that create polymers (polyethylene, polypropylene, polystyrene, and others) from chemical building blocks known as monomers (C2=, C3=, C4=, iC5=, and others). A catalyst is injected with the monomers under carefully controlled temperature and pressure conditions to cause a reaction that grows the polymer chains. Hydrogen is a chain transfer agent to stop the growth of the polymer chain. If the polymer chains grow too long then the polymer is too viscous for manufacturing in films, injection molding, or other applications. | 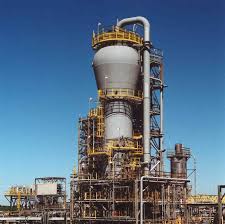 |
If the polymer chains are too short then the polymer is soft and does not have the strength for the particular application such as a plastic bag, a car bumper, or washing machine drum. Regular lab samples from the reactor are used to keep the polymer at the right viscosity for each particular grade. The grade is specified by the customer and may include specifications for:
- Melt Index (Polyethylene)
- Melt Flow Rate (Polypropylene)
- Density
- Xylene Solubles (Measure of Polymer Crystallinity)
This case study focuses on measurements of Melt Flow Rate (MFR) to determine the polymer viscosity based on reactor conditions. An accurate model is desirable so that the infrequent lab samples (every 2-8 hours) are supplemented with a virtual and continuous "soft sensor". A model that runs in real-time simulation alongside the physical reactor is called a digital twin.
Objective: Develop a prediction of the reactor MFR from the polymer reactor data set. Report the correlation coefficient (R2) for predicting ln(MFR) in the test set. Randomly select values that split the data into a train (80%) and test (20%) set. Use Linear Regression, Neural Network (Deep Learning), and another regression method of your choice. Discuss the performance of each. Submit source code and a summary memo (max 2 pages) of your results.
Regression: Use 3 regression methods. Possible regression methods are:
Data: The data file contains tags from process instruments. The specific meaning of the tags is unknown but the follow table is an educated guess based on the name and range of values:
| Label | Data File Tag | Description |
|---|---|---|
| Time | Timestamp of the measurements | |
| C3= | 513FC31103.pv | Propylene (C3=) Feed Rate (kg/hr) |
| H2R | 513HC31114-5.mv | Hydrogen to C3= Ratio |
| Pressure | 513PC31201.pv | Reactor Pressure (bar) |
| Level | 513LC31202.pv | Reactor Bed Level (m) |
| C2= | 513FC31409.pv | Ethylene (C2=) Flow (kg/hr) |
| Cat | 513FC31114-5.pv | Catalyst Feed Rate (kg/hr) |
| Temp | 513TC31220.pv | Reactor Temperature |
| MFR | MFR | Melt Flow Rate (gm/10min) |
The data set has missing data and outliers so data visualization and exploration are needed to first cleanse the data set. Create a new data column as the natural log of MFR (ln(MFR)). The natural log of MFR is a better label (measured output) than MFR. This transform has a more linear relationship between the reactor conditions (inputs) and the predicted ln(MFR) output.
Use the TCLab Data Science modules 2-6 (Import, Analyze, Visualize, Prepare Data, Regression) as a template for analyzing and performing the regression.
References
- Roychadhury, A. Predict MFR of Polymer, Kaggle, Retrieved Jan 22, 2021.
- Hedengren, J.D. Allsford, K.V., and Ramlal, J., Moving Horizon Estimation and Control for an Industrial Gas Phase Polymerization Reactor, Proceedings of the American Control Conference (ACC), New York, NY, pp. 1353-1358, July 2007. Preprint
Solutions


Generative AI Learning
Use these prompts to test your understanding after completing the case study. Direct the AI — you own the data preparation and the model comparison.
Tip: This is a real industrial soft-sensor problem, and modern practice ships the model with documentation: a model card stating training data range, expected accuracy, and known failure modes. Write one — it forces every judgment this assignment is testing.
What to Turn In
Submit your source code and a summary memo (PDF, maximum 2 pages) that curates your results into a demonstration of what you learned. You may use Generative AI to help write the memo, but you must guide it to the correct visualizations, justifications, and assumptions. Answer these questions:
- Report train and test R-squared for all three methods in a table, with your 80/20 split stated. Interpret any train-test gap.
- Include one parity plot (predicted vs measured ln(MFR)) for your best model and a residual plot against one key input. Do the residuals show structure or noise?
- What data cleansing did you apply, and how many points did it remove? Show one example of a removed point and justify the removal.
- Include a 5-line model card for the model you defended in the debate prompt: intended use, training data range, test accuracy, known failure modes, and retraining trigger. Note where the AI's defense and your attack disagreed, and who was right.
- From the quiz prompt: one question you missed and the corrected answer.