Sonar Detection
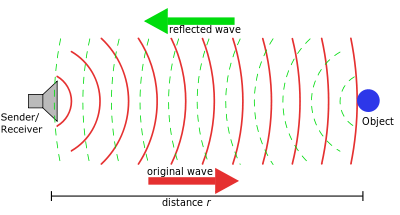
Sonar (sound navigation and ranging) uses sound waves to detect objects, similar to how a bat uses echo-location to navigate, and detect objects. It is the same principle with seismic data for non-invasive underground exploration of geologic formations to locate oil or gas reserves.
| Background: A data set of sonar returns is available for rock and metal pipe with samples taken from different angles and locations. The data was collected in a laboratory under controlled conditions as a case study for detecting underground pipe. There are 111 labeled sets for the metal cylinder (pipe) and 97 sonar patterns from rocks with similar conditions. Each sample is a set of 60 numbers between 0 and 1 that represents the integrated energy within a distinct frequency band and for a given time period. | 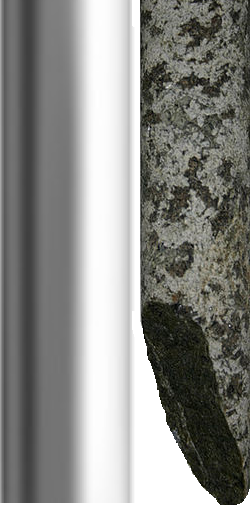 |
Although this case study is specific to detecting differences between metal pipe and rock, it is similar to detection of other underground features such as tunnels, mines, aquifers, and fluid-filled pipelines.

This case study focuses on classification using the 60 attributes (sonar returns) to determine whether object is rock or a metal pipe. The label associated with each record contains the letter R if the object is a rock and M if it is a metal pipe. Encoding is needed to translate this character label into a binary representation (0 or 1) for classification.
url = 'http://apmonitor.com/pds/uploads/Main/sonar_detection.txt'
data = pd.read_csv(url)
# Enocde 'Class' (1 is 'Metal', 0 is 'Rock') with list comprehension
data.Class = [1 if x=='M' else 0 for x in data.Class]


Objective: Develop 8 classifiers from the sonar data set. Report the confusion matrix on the test set for each classifier. Randomly select values that split the data into a train (80%) and test (20%) set by using the sklearn train_test_split with shuffle=True. Use 8 supervised learning methods of your choice. Discuss the performance of each. Submit source code and an executive summary memo (max 2 pages) of your results.

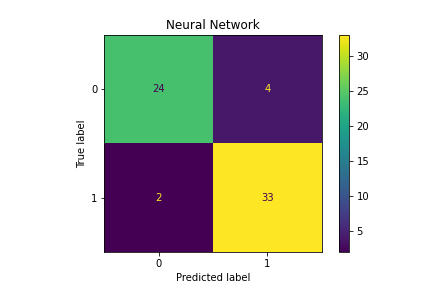
Evaluation: A confusion matrix shows true positive, false positive, true negative, and false negative groups from the test set. Generate a confusion matrix for each classifier.
Classification: Use 8 classification methods. Possible classification methods are:
- Adaptive Boosting (AdaBoost)
- Logistic Regression
- Naïve Bayes
- Stochastic Gradient Descent
- K-Nearest Neighbors
- Decision Tree
- Random Forest
- Support Vector Classifier
- Deep Learning Neural Network
The data set may have outliers so data visualization and exploration are needed to first cleanse the data set.
Use the TCLab Data Science modules 2-5 and 7-8 (Import, Analyze, Visualize, Prepare Data, Features, Classification) as a template for analyzing and performing the classification.
References
- Gorman, R. P., and Sejnowski, T. J. (1988). Analysis of Hidden Units in a Layered Network Trained to Classify Sonar Targets, Neural Networks, Vol. 1, pp. 75-89. Article
- Connectionist Bench (Sonar, Mines vs. Rocks) Data Set, Machine Learning Repository, Center for Machine Learning and Intelligent Systems. Archive

Solutions


Generative AI Learning
Use these prompts to test your understanding after completing the case study. Direct the AI — you own the eight classifiers and their evaluation.
Tip: Rerun your entire comparison with a different random_state in train_test_split. With 208 samples, ranking changes between runs are normal — any conclusion that does not survive a reshuffle is noise, not signal.
What to Turn In
Submit a short report (PDF, 1-2 pages) that curates your results into a demonstration of what you learned. You may use Generative AI to help write the report, but you must guide it to the correct visualizations, justifications, and assumptions. Answer these questions:
- Present all eight classifiers in one table: accuracy, precision, recall, and F1 for the metal class on the test set, with the confusion matrix for your best and worst performers shown.
- Which classifier would you deploy for harbor mine detection, and why might it NOT be the highest-accuracy one? Argue from false-negative cost.
- Show the ranking from two different random splits. Which conclusions survived, and which flipped?
- From the confusion-matrix audit prompt: what did the AI catch or get wrong reasoning from matrices alone, and what did you have to check in the raw data to settle it?