CO2 Sensors: SCD30/SCD4x
Monitoring CO₂ levels is essential for environmental studies, building management, and indoor air quality assessment. The SCD30 and SCD40 are CO₂ sensors that measure gas concentration using non-dispersive infrared (NDIR) technology. The SCD40/41 photoacoustic measurement system has a smaller form factor by 5x over the SCD30.
These sensors measure CO₂ concentrations with SCD30 ranging 400-10,000 ppm, SCD40 ranging from 400-2,000 ppm, and SCD41 ranging from 400-5,000 ppm. They also have integrated temperature and humidity sensing with the SHT4x sensor for temperature compensation and for comprehensive environmental monitoring.
SCD30/4x CO₂ Measurement Module
The SCD30 (green), SCD40 (purple), SCD41 (blue) modules include an NDIR CO2 sensor, a temperature sensor, and a humidity sensor. These sensors are compact, consume low power, and are calibrated for long-term stability. The NDIR technology has high accuracy (SCD30 ±30 ppm and SCD40/41 ±50 ppm CO₂ accuracy) in CO₂ measurements.
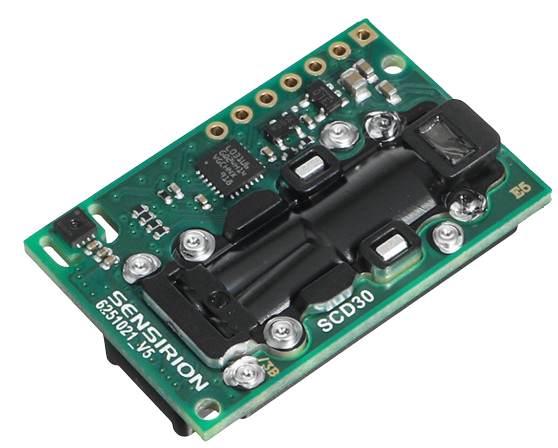
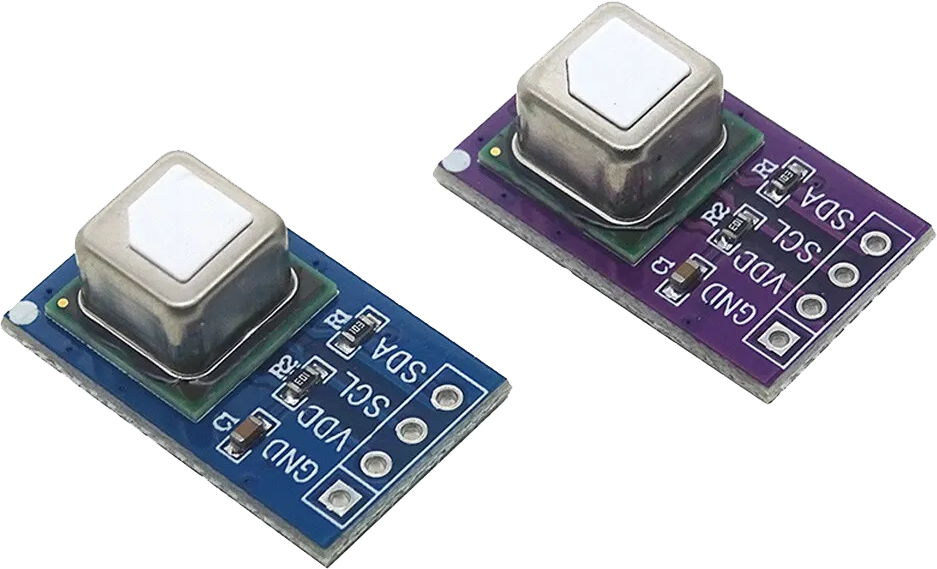
These modules are interfaced with microcontrollers like the Arduino or ESP32 via an I2C connection. The SCD30/4x sensors are configured for different measurement intervals, and they support automatic baseline correction to adapt to changing environments.
SCD30 with MicroPython
import scd30
import time
# I2C Connection
i2c = SoftI2C(scl=Pin(22), sda=Pin(21))
# SCD30 sensor
sensor = scd30.SCD30(i2c, addr=0x61)
sensor.start_continous_measurement()
while True:
if sensor.get_status_ready():
co2, temp, rh = sensor.read_measurement()
print(f"CO2: {co2}ppm, Temp: {temp}C, Hum: {rh}%")
else:
print("Measurement not ready.")
time.sleep(5)
The scd30.py library is required to interface with the CO₂ sensors and obtain temperature, humidity, and concentration readings.
import utime
import struct
class SCD30:
class NotFoundException(Exception):
pass
class CRCException(Exception):
pass
START_CONT_MEASURE = 0x0010
STOP_CONT_MEASURE = 0x0104
SET_MEASURE_INTERVAL = 0x4600
GET_STATUS_READY = 0x0202
READ_MEASUREMENT = 0x0300
SET_ASC = 0x5306
SET_FRC = 0x5204
SET_TEMP_OFFSET = 0x5403
SET_ALT_COMP = 0x5102
GET_FIRMWARE_VER = 0xd100
SOFT_RESET = 0xd304
CLOCK_TIME_US = 10
# Generated using
# crc_table = []
# for crc in range(256):
# for crc_bit in range(8):
# if crc & 0x80:
# crc = (crc << 1) ^ CRC8_POLYNOMIAL;
# else:
# crc = (crc << 1);
# crc = crc%256
# crc_table.append(crc)
CRC_TABLE = [
0, 49, 98, 83, 196, 245, 166, 151, 185, 136, 219, 234, 125, 76, 31, 46,
67, 114, 33, 16, 135, 182, 229, 212, 250, 203, 152, 169, 62, 15, 92, 109,
134, 183, 228, 213, 66, 115, 32, 17, 63, 14, 93, 108, 251, 202, 153, 168,
197, 244, 167, 150, 1, 48, 99, 82, 124, 77, 30, 47, 184, 137, 218, 235,
61, 12, 95, 110, 249, 200, 155, 170, 132, 181, 230, 215, 64, 113, 34, 19,
126, 79, 28, 45, 186, 139, 216, 233, 199, 246, 165, 148, 3, 50, 97, 80,
187, 138, 217, 232, 127, 78, 29, 44, 2, 51, 96, 81, 198, 247, 164, 149,
248, 201, 154, 171, 60, 13, 94, 111, 65, 112, 35, 18, 133, 180, 231, 214,
122, 75, 24, 41, 190, 143, 220, 237, 195, 242, 161, 144, 7, 54, 101, 84,
57, 8, 91, 106, 253, 204, 159, 174, 128, 177, 226, 211, 68, 117, 38, 23,
252, 205, 158, 175, 56, 9, 90, 107, 69, 116, 39, 22, 129, 176, 227, 210,
191, 142, 221, 236, 123, 74, 25, 40, 6, 55, 100, 85, 194, 243, 160, 145,
71, 118, 37, 20, 131, 178, 225, 208, 254, 207, 156, 173, 58, 11, 88, 105,
4, 53, 102, 87, 192, 241, 162, 147, 189, 140, 223, 238, 121, 72, 27, 42,
193, 240, 163, 146, 5, 52, 103, 86, 120, 73, 26, 43, 188, 141, 222, 239,
130, 179, 224, 209, 70, 119, 36, 21, 59, 10, 89, 104, 255, 206, 157, 172
]
def __init__(self, i2c, addr, pause=1000):
self.i2c = i2c
self.pause = pause
self.addr = addr
if not addr in i2c.scan():
raise self.NotFoundException
def start_continous_measurement(self, ambient_pressure=0):
bint = struct.pack('>H', ambient_pressure)
crc = self.__crc(bint[0], bint[1])
data = bint + bytes([crc])
self.i2c.writeto_mem(self.addr, self.START_CONT_MEASURE, data, addrsize=16)
def stop_continous_measurement(self):
self.__write_command(self.STOP_CONT_MEASURE)
def soft_reset(self):
self.__write_command(self.SOFT_RESET)
def get_firmware_version(self):
ver = self.__read_bytes(self.GET_FIRMWARE_VER, 3)
self.__check_crc(ver)
return struct.unpack('BB', ver)
def read_measurement(self):
measurement = self.__read_bytes(self.READ_MEASUREMENT, 18)
for i in range(0, len(measurement), 3):
self.__check_crc(measurement[i:i+3])
value = measurement[0:]
co2 = struct.unpack('>f', value[0:2] + value[3:5])[0]
value = measurement[6:]
temperature = struct.unpack('>f', value[0:2] + value[3:5])[0]
value = measurement[12:]
relh = struct.unpack('>f', value[0:2] + value[3:5])[0]
return (co2, temperature, relh)
def get_status_ready(self):
ready = self.__read_bytes(self.GET_STATUS_READY, 3)
self.__check_crc(ready)
return struct.unpack('>H', ready)[0]
def get_measurement_interval(self):
bint = self.__read_bytes(self.SET_MEASURE_INTERVAL, 3)
self.__check_crc(bint)
return struct.unpack('>H', bint)[0]
def set_measurement_interval(self, interval):
bint = struct.pack('>H', interval)
crc = self.__crc(bint[0], bint[1])
data = bint + bytes([crc])
self.i2c.writeto_mem(self.addr, self.SET_MEASURE_INTERVAL, data, addrsize=16)
def get_automatic_recalibration(self):
bint = self.__read_bytes(self.SET_ASC, 3)
self.__check_crc(bint)
return struct.unpack('>H', bint)[0] == 1
def set_automatic_recalibration(self, enable):
bint = struct.pack('>H', 1 if enable else 0)
crc = self.__crc(bint[0], bint[1])
data = bint + bytes([crc])
self.i2c.writeto_mem(self.addr, self.SET_FRC, data, addrsize=16)
def get_forced_recalibration(self):
bint = self.__read_bytes(self.SET_FRC, 3)
self.__check_crc(bint)
return struct.unpack('>H', bint)[0]
def set_forced_recalibration(self, co2ppm):
bint = struct.pack('>H', co2ppm)
crc = self.__crc(bint[0], bint[1])
data = bint + bytes([crc])
self.i2c.writeto_mem(self.addr, self.SET_FRC, data, addrsize=16)
def get_temperature_offset(self):
bint = self.__read_bytes(self.SET_TEMP_OFFSET, 3)
self.__check_crc(bint)
return struct.unpack('>H', bint)[0] / 100.0
def set_temperature_offset(self, offset):
bint = struct.pack('>H', int(offset * 100))
crc = self.__crc(bint[0], bint[1])
data = bint + bytes([crc])
self.i2c.writeto_mem(self.addr, self.SET_TEMP_OFFSET, data, addrsize=16)
def get_altitude_comp(self):
bint = self.__read_bytes(self.SET_ALT_COMP, 3)
self.__check_crc(bint)
return struct.unpack('>H', bint)[0]
def set_altitude_comp(self, altitude):
bint = struct.pack('>H', altitude)
crc = self.__crc(bint[0], bint[1])
data = bint + bytes([crc])
self.i2c.writeto_mem(self.addr, self.SET_ALT_COMP, data, addrsize=16)
def __write_command(self, cmd):
bcmd = struct.pack('>H', cmd)
self.i2c.writeto(self.addr, bcmd)
def __read_bytes(self, cmd, count):
self.__write_command(cmd)
utime.sleep_us(self.pause)
return self.i2c.readfrom(self.addr, count)
def __check_crc(self, arr):
assert (len(arr) == 3)
if self.__crc(arr[0], arr[1]) != arr[2]:
raise self.CRCException
def __crc(self, msb, lsb):
crc = 0xff
crc ^= msb
crc = self.CRC_TABLE[crc]
if lsb is not None:
crc ^= lsb
crc = self.CRC_TABLE[crc]
return crc
SCD4x with Micropython
from machine import SoftI2C, Pin
from scd4x import SCD4X
# I2C Connection for SCD40
i2c = SoftI2C(scl=Pin(18),sda=Pin(19))
# SCD40 sensor
sensor = SCD4X(i2c)
sensor.start_periodic_measurement()
while True:
time.sleep(5)
co2, temp, rh = sensor.co2, sensor.temperature, sensor.relative_humidity
if co2 is not None and temp is not None and rh is not None:
print(f"CO2: {co2}ppm, Temp: {temp:.2f}C, Hum: {rh:.2f}%")
else:
print("Measurement not ready.")
The scd4x.py library is required to interface with the CO₂ sensors and obtain temperature, humidity, and concentration readings.
class SCD4X:
"""
Based on https://github.com/adafruit/Adafruit_CircuitPython_SCD4X
Copyright (c) 2021 ladyada for Adafruit Industries
MIT License
"""
from micropython import const
DEFAULT_ADDRESS = 0x62
DATA_READY = const(0xE4B8)
STOP_PERIODIC_MEASUREMENT = const(0x3F86)
START_PERIODIC_MEASUREMENT = const(0x21B1)
READ_MEASUREMENT = const(0xEC05)
def __init__(self, i2c_bus, address=DEFAULT_ADDRESS):
self.i2c = i2c_bus
self.address = address
self._buffer = bytearray(18)
self._cmd = bytearray(2)
self._crc_buffer = bytearray(2)
# cached readings
self._temperature = None
self._relative_humidity = None
self._co2 = None
self.stop_periodic_measurement()
@property
def co2(self):
"""Returns the CO2 concentration in PPM (parts per million)
.. note::
Between measurements, the most recent reading will be cached and returned.
"""
if self.data_ready:
self._read_data()
return self._co2
@property
def temperature(self):
"""Returns the current temperature in degrees Celsius
.. note::
Between measurements, the most recent reading will be cached and returned.
"""
if self.data_ready:
self._read_data()
return self._temperature
@property
def relative_humidity(self):
"""Returns the current relative humidity in %rH.
.. note::
Between measurements, the most recent reading will be cached and returned.
"""
if self.data_ready:
self._read_data()
return self._relative_humidity
def _read_data(self):
"""Reads the temp/hum/co2 from the sensor and caches it"""
self._send_command(self.READ_MEASUREMENT, cmd_delay=0.001)
self._read_reply(self._buffer, 9)
self._co2 = (self._buffer[0] << 8) | self._buffer[1]
temp = (self._buffer[3] << 8) | self._buffer[4]
self._temperature = -45 + 175 * (temp / 2 ** 16)
humi = (self._buffer[6] << 8) | self._buffer[7]
self._relative_humidity = 100 * (humi / 2 ** 16)
@property
def data_ready(self):
"""Check the sensor to see if new data is available"""
self._send_command(self.DATA_READY, cmd_delay=0.001)
self._read_reply(self._buffer, 3)
return not ((self._buffer[0] & 0x03 == 0) and (self._buffer[1] == 0))
def stop_periodic_measurement(self):
"""Stop measurement mode"""
self._send_command(self.STOP_PERIODIC_MEASUREMENT, cmd_delay=0.5)
def start_periodic_measurement(self):
"""Put sensor into working mode, about 5s per measurement"""
self._send_command(self.START_PERIODIC_MEASUREMENT, cmd_delay=0.01)
def _send_command(self, cmd, cmd_delay=0.0):
self._cmd[0] = (cmd >> 8) & 0xFF
self._cmd[1] = cmd & 0xFF
self.i2c.writeto(self.address, self._cmd)
time.sleep(cmd_delay)
def _read_reply(self, buff, num):
self.i2c.readfrom_into(self.address, buff, num)
self._check_buffer_crc(self._buffer[0:num])
def _check_buffer_crc(self, buf):
for i in range(0, len(buf), 3):
self._crc_buffer[0] = buf[i]
self._crc_buffer[1] = buf[i + 1]
if self._crc8(self._crc_buffer) != buf[i + 2]:
raise RuntimeError("CRC check failed while reading data")
return True
@staticmethod
def _crc8(buffer):
crc = 0xFF
for byte in buffer:
crc ^= byte
for _ in range(8):
if crc & 0x80:
crc = (crc << 1) ^ 0x31
else:
crc = crc << 1
return crc & 0xFF

✅ Activity: Monitor CO₂ with SCD30/4x
Applications of these CO₂ sensors include:
- Environmental Monitoring: Tracking CO₂ levels in outdoor environments to study air quality.
- Indoor Air Quality: Monitoring CO₂ concentration in buildings, schools, and offices to ensure a healthy indoor environment. Recommended range is 700-1,000ppm with below 700ppm for maximum comfort.
- Horticulture: Managing CO₂ levels in greenhouses to optimize plant growth.
- Scientific Research: Utilizing precise CO₂ measurements in various research fields.
Case Study: Daily CO₂ Monitoring
In this case study, the CO₂ concentration in an office is measured throughout the day using the SCD30 sensor and an ESP32. The presence of plants in the room can cause the CO₂ concentration to drop below the base outside air value (~421 ppm in 2024).
import scd30
import time
# Initialize I2C for SCD30
i2c = SoftI2C(scl=Pin(22), sda=Pin(21))
sensor = scd30.SCD30(i2c, addr=0x61)
# Start Continuous Measurement for SCD30
sensor.start_continous_measurement()
# Open file to record data
with open('co2_data.csv', 'w') as fid:
fid.write('Time,Temp,Humidity,CO2\n')
st = time.time()
# Run for 16 hours
for i in range(1440):
# Read from SCD30
if sensor.get_status_ready():
co2, temp, hum = sensor.read_measurement()
else:
time.sleep(0.1)
continue
# Write data to file
with open('co2_data.csv', 'a') as fid:
fid.write(f'{(time.time()-st)/60.0},{temp},{hum},{co2}\n')
print(f'{i} T:{temp}C H:{hum}% CO2:{co2}ppm')
# Wait 40 sec before reading again
time.sleep(40)
Results and Discussion
import datetime
import matplotlib.pyplot as plt
import matplotlib.dates as mdates
file = 'co2_data.csv'
url = 'http://apmonitor.com/dde/uploads/Main/'
data = pd.read_csv(url+file)
# Starting time is 11:00 AM on Feb 14, 2024
st = datetime.datetime(2024, 2, 14, 11, 0)
# Create a time range based on Time
tr = [st + datetime.timedelta(minutes=x) \
for x in data['Time']]
data['Time'] = tr
# Create plot
data.set_index('Time',drop=True,inplace=True)
data.plot(subplots=True)
plt.gca().xaxis.set_major_formatter(mdates.DateFormatter('%H:%M'))
plt.tight_layout(); plt.savefig('co2_data.png',dpi=300)
plt.show()
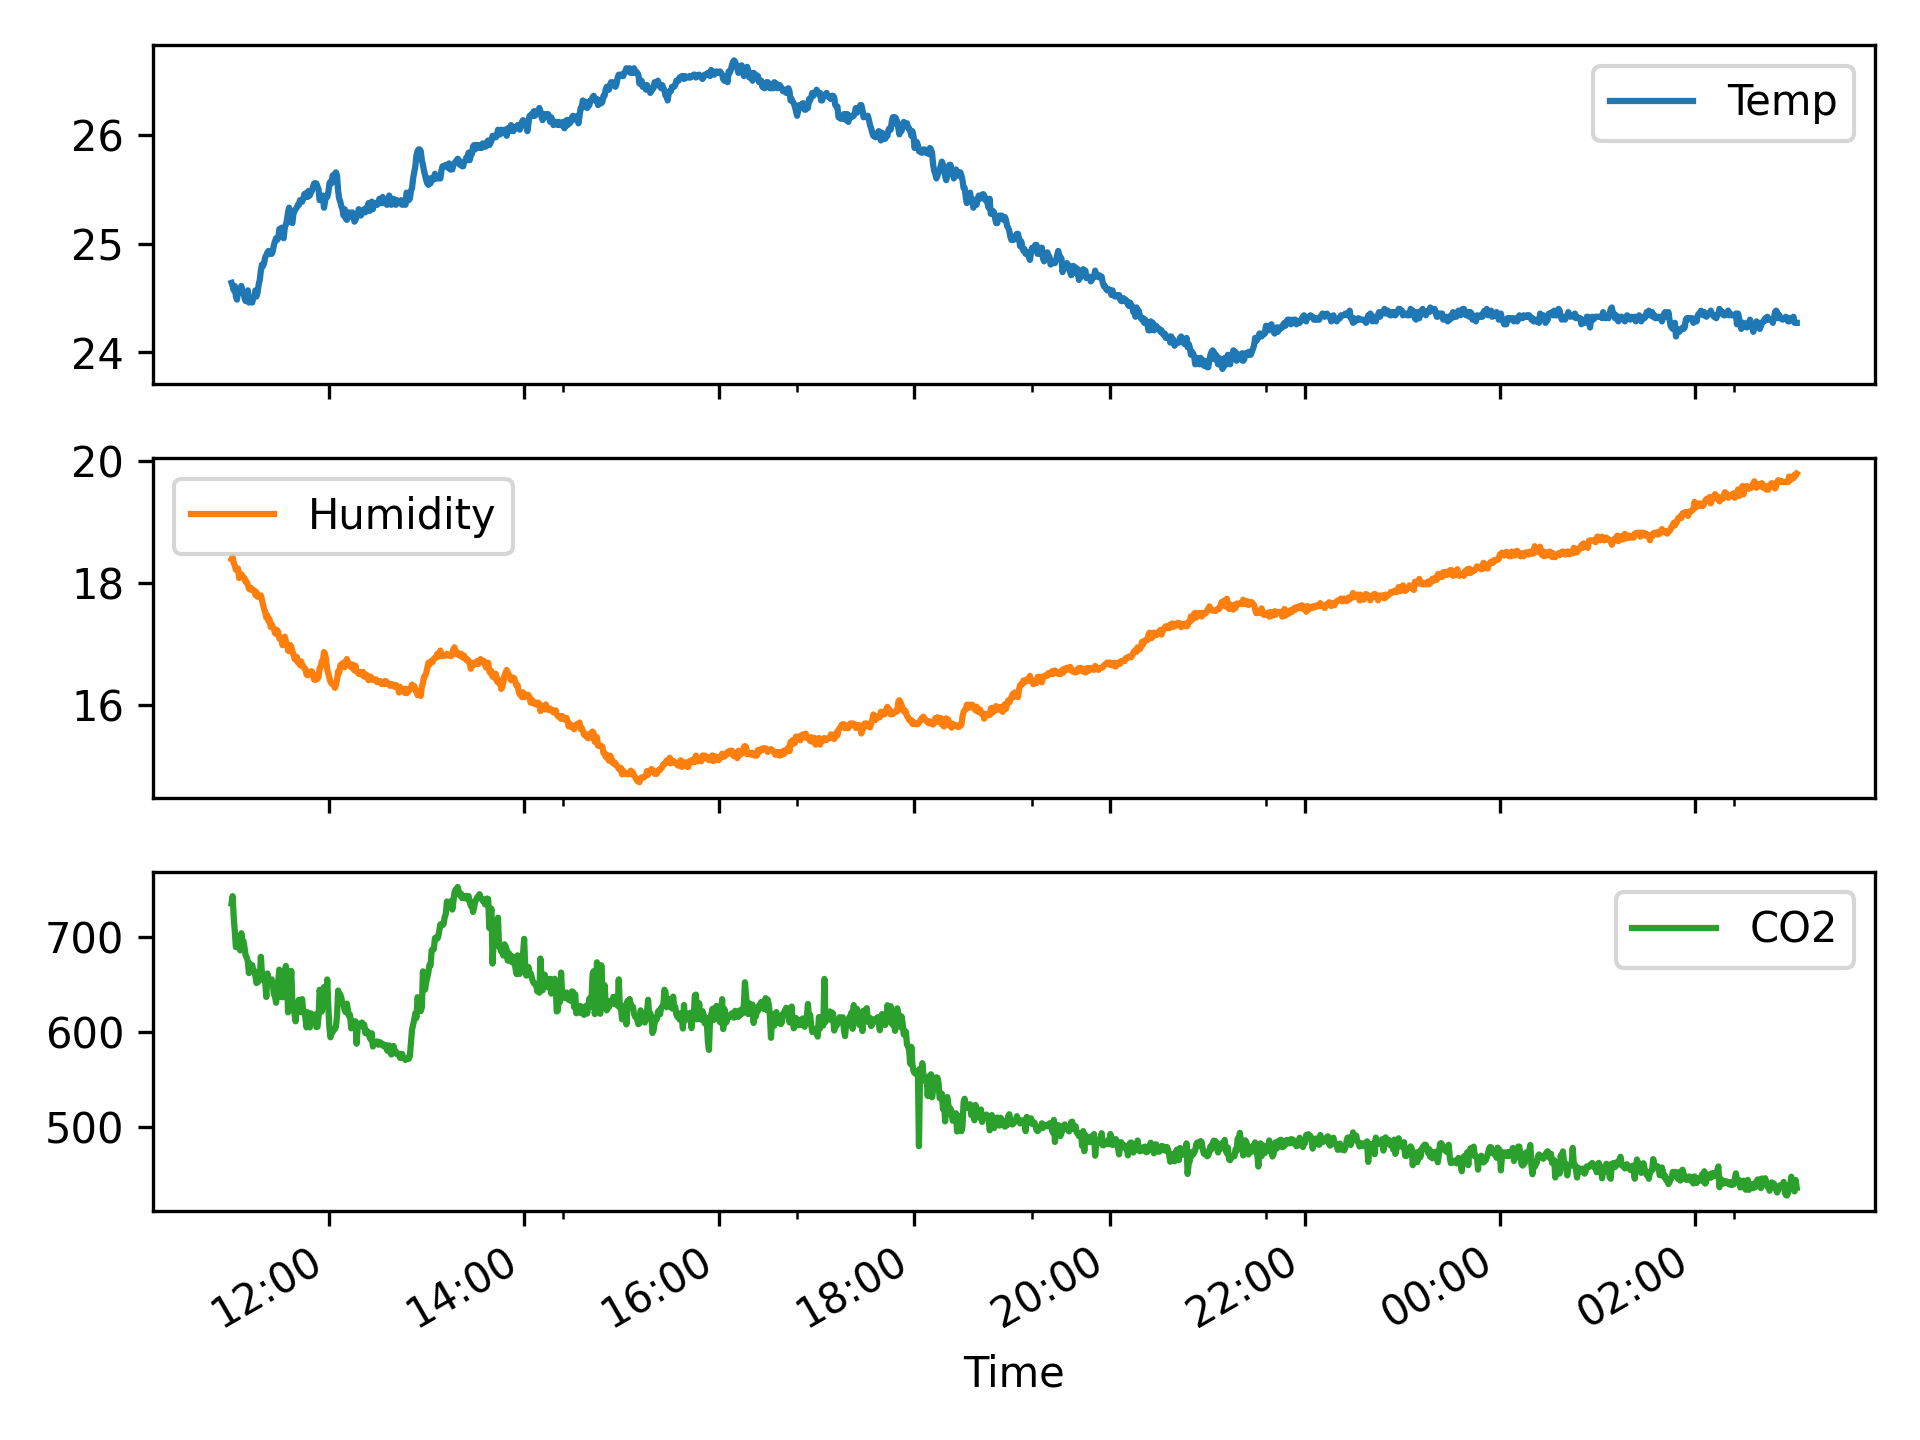
The SCD30 sensor measured fluctuations in CO₂ levels throughout the day. Higher concentrations were noted during the daytime in the room due to human occupancy and lower levels at night. There were no plants in the room to reduce CO₂ levels during daylight hours. Plants can sometimes achieve even lower CO₂ levels than outdoor due to photosynthesis. This study highlights the importance of monitoring CO₂ for managing indoor air quality and understanding environmental dynamics.
Case Study: Outdoor CO₂ Monitoring
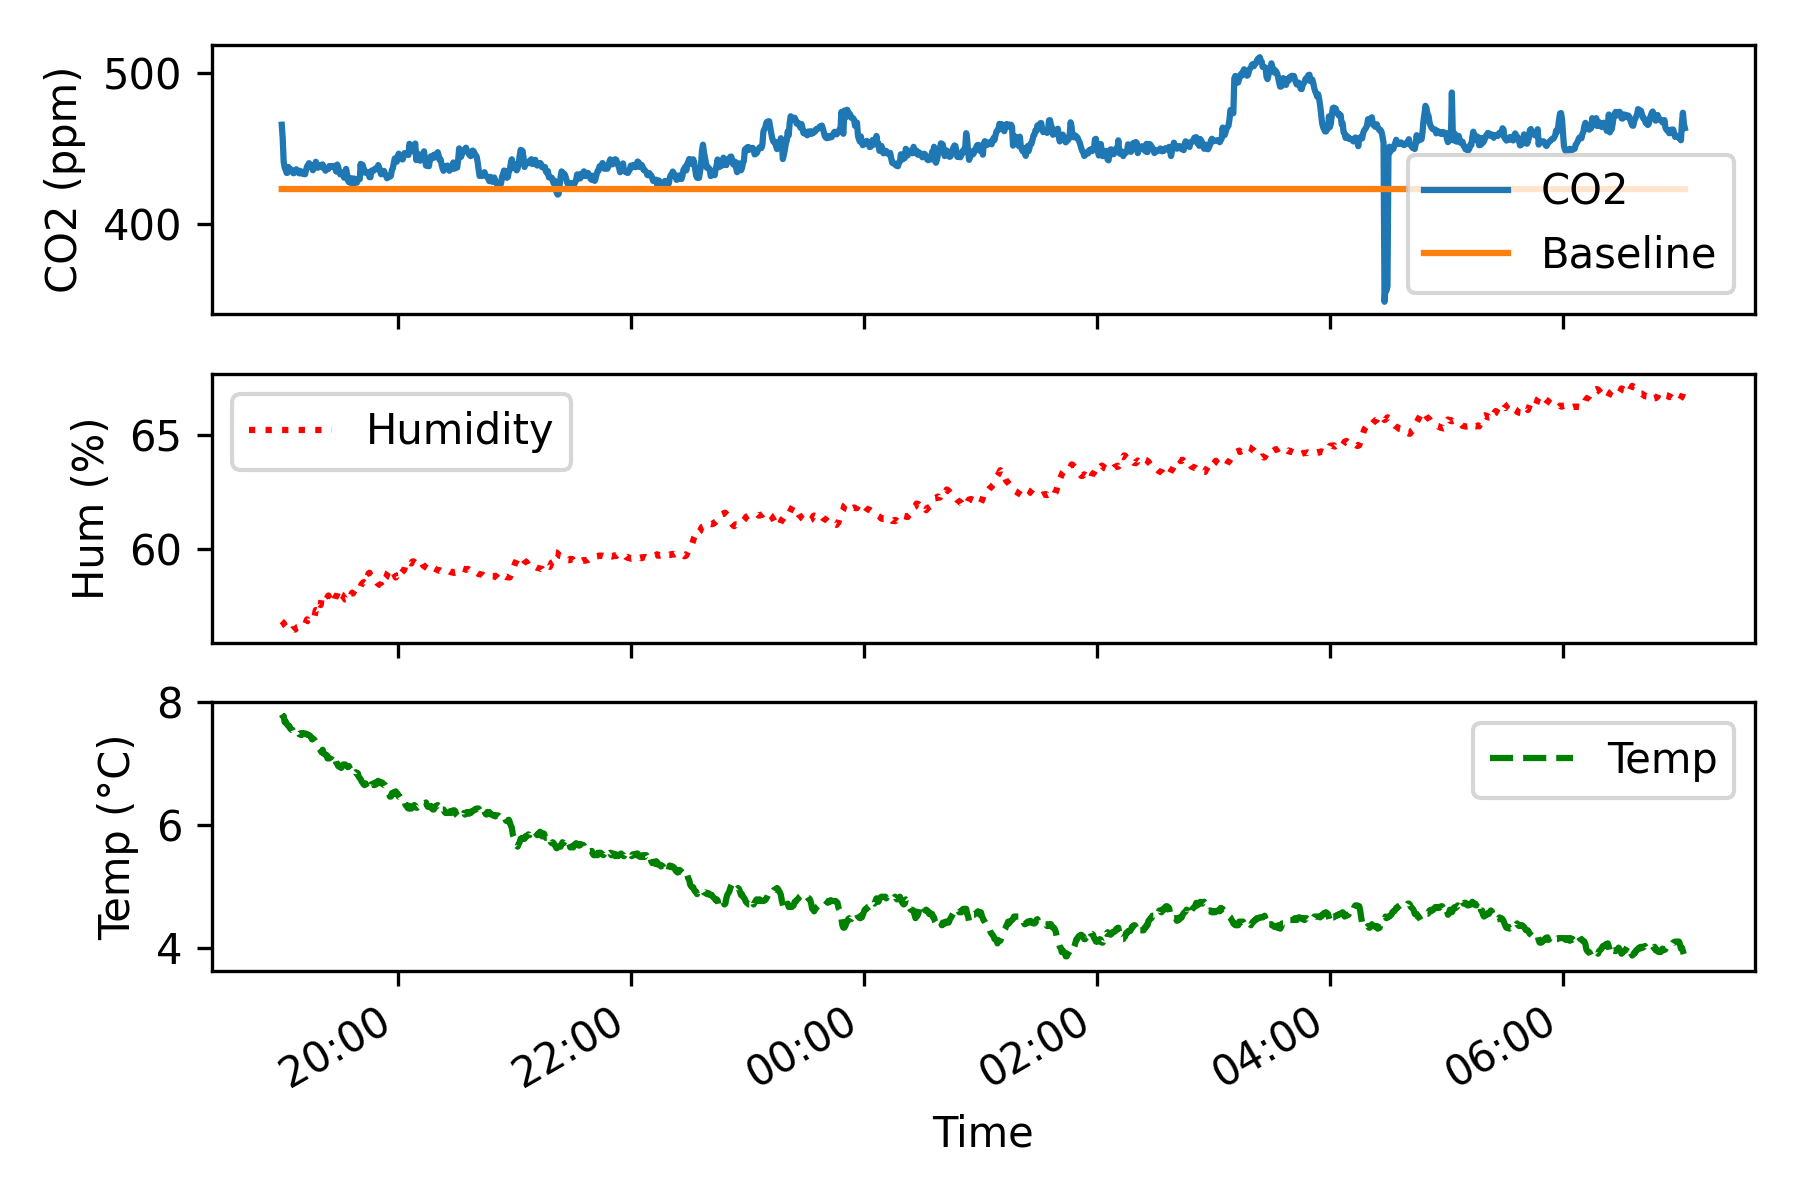
Outdoor CO₂ concentration is monitored with the SCD30 sensor over 12 hours in a residential community in Provo, UT on Feb 16-17, 2024. Note the periods of increase in CO₂ concentration as local concentration increases likely due to local natural gas furnace emissions and from microbial emissions from the soil. The CO₂ levels decrease during the day when plants photosynthesize in the presence of light. Concentrations above background 425 ppm are from local emissions. The local emissions trend downward throughout the night as there is less automotive activity, but the natural gas use in homes increases as the external temperature drops.
import datetime
import matplotlib.pyplot as plt
import matplotlib.dates as mdates
file = 'co2_data2.csv'
url = 'http://apmonitor.com/dde/uploads/Main/'
data = pd.read_csv(url+file)
# Starting time is 7:00 PM on Feb 16, 2024
st = datetime.datetime(2024, 2, 16, 19, 0)
# Create a time range based on Time
tr = [st + datetime.timedelta(minutes=x) \
for x in data['Time']]
data['Time'] = tr
data['Baseline'] = 423.05 # on Feb 16, 2024
data.set_index('Time',drop=True,inplace=True)
# Create plot
fig, axs = plt.subplots(3,1,figsize=(6,4))
data.plot(ax=axs[0],y=['CO2','Baseline'])
axs[0].set_ylabel('CO2 (ppm)')
data.plot(ax=axs[1],y=['Humidity'],color='red',linestyle=':')
axs[1].set_ylabel('Hum (%)')
data.plot(ax=axs[2],y=['Temp'],color='green', linestyle='--')
axs[2].set_ylabel('Temp (°C)')
for i in range(2):
axs[i].set_xticklabels([])
axs[i].set_xlabel('')
plt.gca().xaxis.set_major_formatter(mdates.DateFormatter('%H:%M'))
plt.tight_layout(); plt.savefig('co2_data.png',dpi=300)
plt.show()
Case Study: Compare SCD30 & SCD40
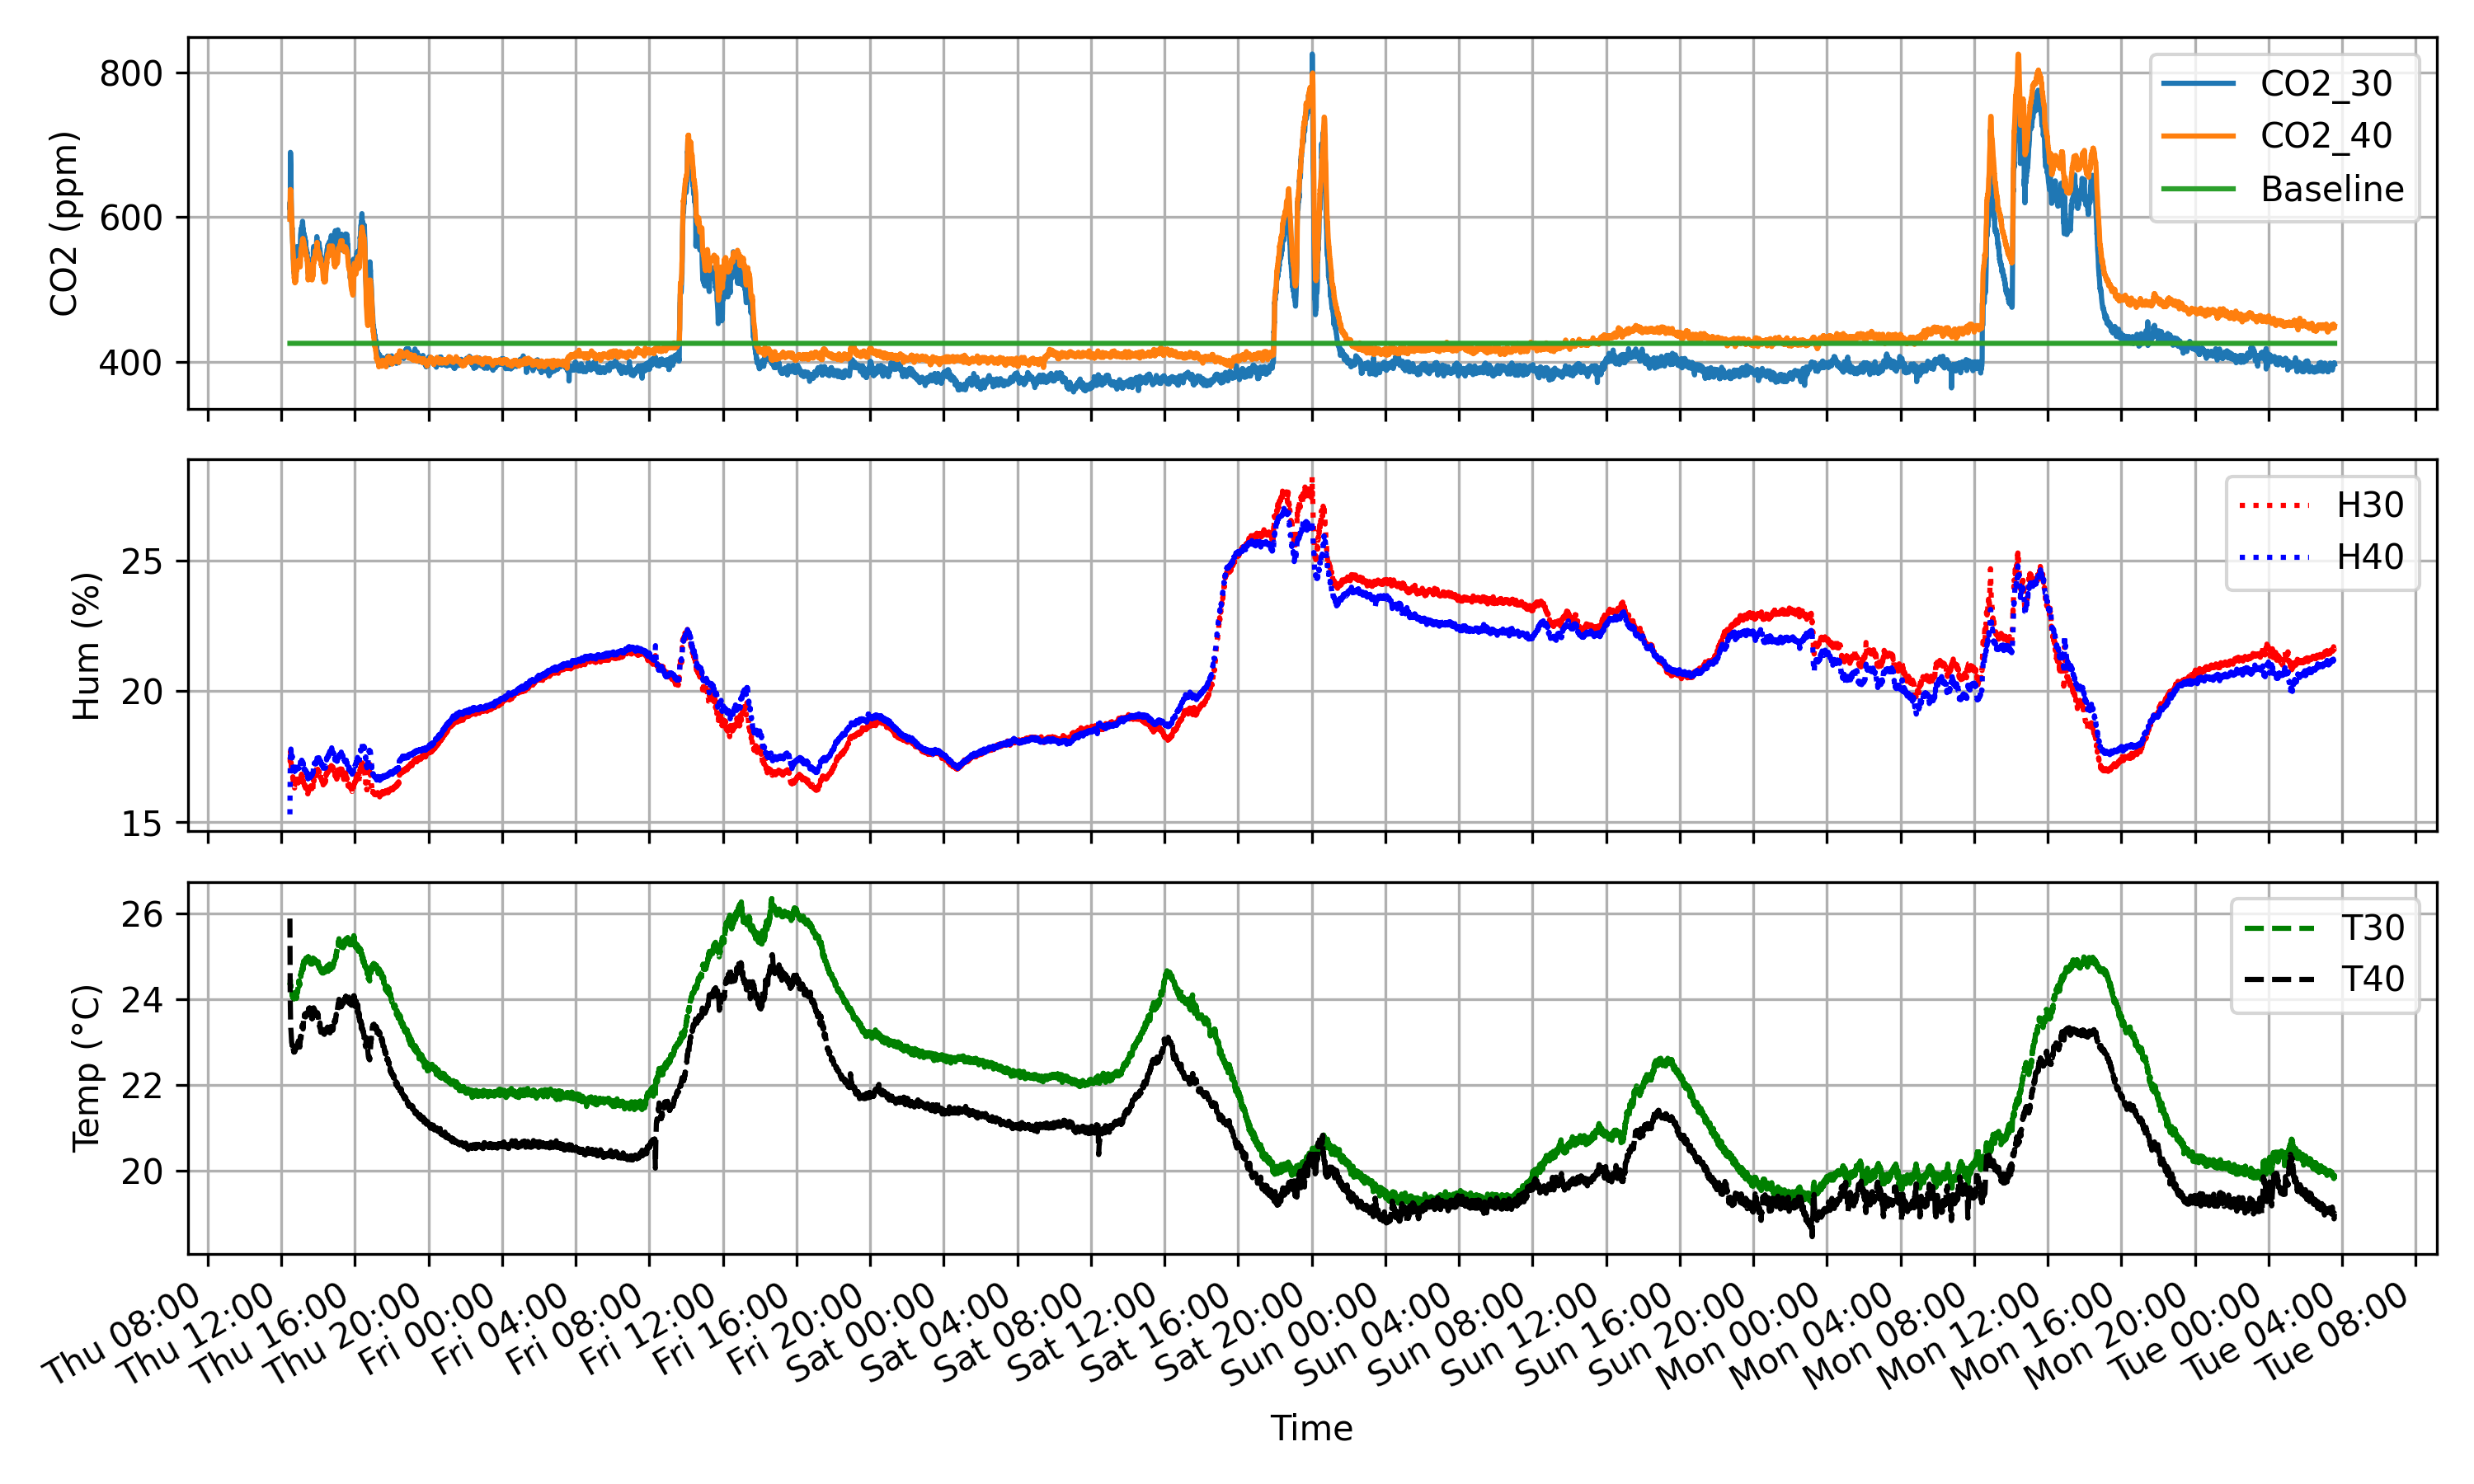
This case study compares SCD30 and SCD40 CO₂ sensors for indoor office air measurement. Several factors are taken into consideration such as the accuracy and precision of these sensors. The SCD30 has an accuracy of ±30 ppm, whereas the SCD40 is slightly less accurate with ±50 ppm. There are similar trend patterns displayed by both sensors but with offset. Calibration differences are a primary consideration. Each sensor has default calibration that is set at manufacture, which varies and influences the responsiveness to identical CO₂ levels. Environmental influences such as temperature and humidity are also factors, as each sensor may have different sensitivity to these factors.
Collect Data from SCD30 & SCD40
import scd30
from scd4x import SCD4X
import time
# SCD30 Sensor
i30 = SoftI2C(scl=Pin(22), sda=Pin(21))
s30 = scd30.SCD30(i30, addr=0x61)
s30.start_continous_measurement()
# SCD40 Sensor
i40 = SoftI2C(sda=Pin(19), scl=Pin(18))
s40 = SCD4X(i40)
s40.start_periodic_measurement()
# file header
with open('co2_data3.csv', 'w') as fid:
fid.write('Time,T30,H30,CO2_30,T40,H40,CO2_40\n')
st = time.time()
while True:
# Wait 20 sec before reading
time.sleep(20)
tm = time.time()
# Read from SCD30
if s30.get_status_ready():
co2_1, t1, h1 = s30.read_measurement()
# Read from SCD40
co2_2, t2, h2 = s40.co2, s40.temperature, s40.relative_humidity
# Write data to file
with open('co2_data.csv', 'a') as fid:
fid.write(f'{(tm-st)/60.0},{t1},{h1},{co2_1},{t2},{h2},{co2_2}\n')
print(f'{(tm-st)/60.0} T1:{t1}C T2:{t2}C ' +
f'H1:{h1}% H2:{h2}% CO2_1:{co2_1}ppm CO2_2:{co2_2}ppm')
Both sensors support Automatic Baseline Correction (ABC) that is important for long-term accuracy. This method adjusts the calibration based on assumed ambient CO₂ level when the space is unoccupied and well-ventilated. Forced calibration is another method where the sensor is manually set to a known CO₂ concentration, often the outdoor ambient level, for recalibration. Additionally, cross-comparison with a highly accurate reference CO₂ sensor can be used to align and adjust the readings from the SCD30 and SCD40. Various factors such as occupancy, ventilation, and time of day influence the CO₂ levels. Comparing the trends from both sensors with occupancy is data that can be used to estimate space utilization from gas concentrations.
Visualize Data from SCD30 & SCD40
import datetime
import matplotlib.pyplot as plt
import matplotlib.dates as mdates
file = 'co2_data3.csv'
url = 'http://apmonitor.com/dde/uploads/Main/'
data = pd.read_csv(url+file)
# Starting time is 12:28 PM on Feb 29, 2024
st = datetime.datetime(2024, 2, 29, 12, 28)
# Create a time range based on Time
tr = [st + datetime.timedelta(minutes=x) \
for x in data['Time']]
data['Time'] = tr
data['Baseline'] = 425.40 # on Feb 29, 2024
data.set_index('Time',drop=True,inplace=True)
# Create plot
fig, axs = plt.subplots(3,1,figsize=(10,6))
data.plot(ax=axs[0],y=['CO2_30','CO2_40','Baseline'])
axs[0].set_ylabel('CO2 (ppm)')
data.plot(ax=axs[1],y=['H30','H40'],color=['red','blue'],linestyle=':')
axs[1].set_ylabel('Hum (%)')
data.plot(ax=axs[2],y=['T30','T40'],color=['green','black'], linestyle='--')
axs[2].set_ylabel('Temp (°C)')
locator = mdates.HourLocator(interval=4)
for ax in axs:
ax.grid()
ax.xaxis.set_major_locator(locator)
ax.xaxis.set_major_formatter(mdates.DateFormatter('%a %H:%M'))
for i in range(2):
axs[i].set_xticklabels([])
axs[i].set_xlabel('')
plt.tight_layout(); plt.savefig('co2_data3.png',dpi=300)
plt.show()
Case Study: Terrarium CO₂ Monitoring
Monitor the CO₂ concentration in a terrarium using the SCD30 sensor and an ESP32 microcontroller. The terrarium, containing both plants and soil, provides an environment to study the interaction between biotic components and the impact on CO₂ levels. Observe the effects of light on CO₂ concentration with likely rising CO₂ levels due to microbial emissions from the soil and decreasing CO₂ levels when plants photosynthesize in the presence of light.
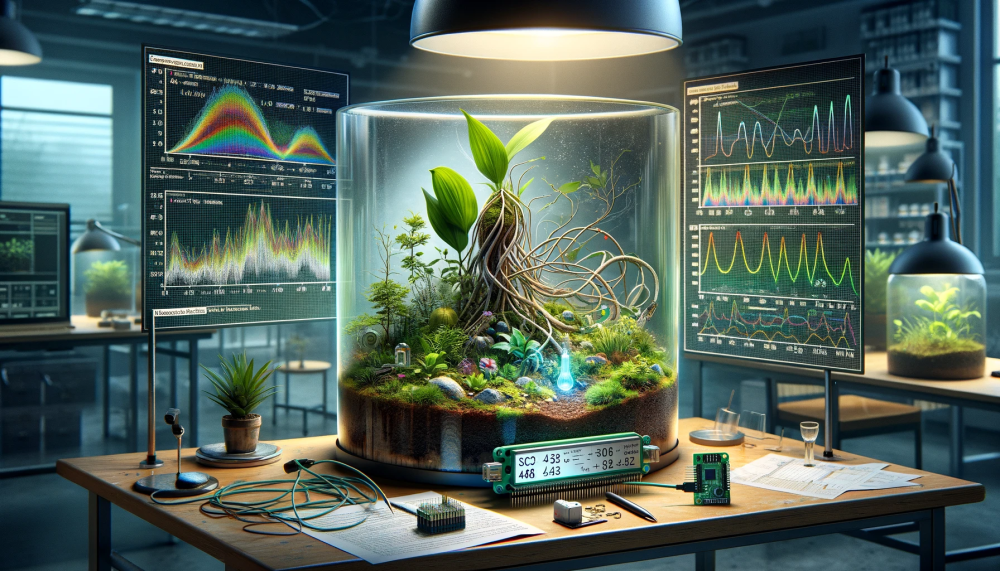
Perform a regression analysis to determine the relationship between light level and CO₂ concentration. Develop a time-series prediction model to forecast future CO₂ levels under varying light conditions. This analysis may utilize time-series forecasting such as ARX (Linear) or Transformers (Nonlinear).
This analysis reveals insights into the dynamic relationship between artificial lighting and CO₂ levels in a terrarium with ties to environmental science, horticulture, and indoor air quality management. The forecast model could further be utilized to optimize conditions in controlled environments like greenhouses, maximizing plant growth while maintaining optimal CO₂ levels.
Thanks to Clint Guymon for the terrarium case study.
Reference
Guymon, C., Tuft, J. R., Climate Change and Kinetics in an Undergraduate Laboratory: Injection and Tracking of CO2 in a 7 Gallon Terrarium, 2024 ASEE Annual Conference & Exposition, June 2024, Portland, Oregon. https://peer.asee.org/48465

