Dynamic Estimation Statistics
Sensitivity and statistical analysis are important methods to understand the behavior of dynamic estimators such as Moving Horizon Estimation (MHE).
Case Study 1: Reversible Reaction
The reaction of phenolphthalein with a base solution follows the 2 reaction sequence given below.
- Reaction 1:
- Irreversible reaction, fast reaction dynamics
- Ph + 2 OH- => Ph(2-) + 2 H2O
- Reaction 2:
- Reversible, slow reaction dynamics
- Ph(2-) + OH- <=> PhOH(3-)
Reaction 1 is very fast and can be assumed to be instantaneous when the phenolphthalein (Ph) is added to a hydroxide solution. We are considering using phenolphthalein as an indicator to determine the residence time of several large CSTR reactors in a pilot plant. Please determine the kinetic parameters for reaction 2 with respect to phenolphthalein associated with the fading of phenolphthalein in sodium hydroxide solutions (reaction orders, A1, A2, Ea1, and Ea2).
An engineer collected time-varying data for a non-isothermal run and needs you to estimate the kinetic parameters. The temperature ranged from about 60 - 140 degF. In order to appropriately size the reactor vessel, engineers need the kinetic parameters with the associated 95% confidence intervals.

Nonlinear Confidence Interval for Dye Fading Kinetics
Nonlinear confidence intervals can also be visualized as a function of 2 parameters. In this case, both parameters are simultaneously varied to find the confidence region. The confidence interval is determined with an F-test that specifies an upper limit to the deviation from the optimal solution
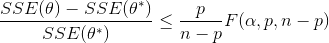
with p=2 (number of parameters), n=number of measurements, theta=[parameter 1, parameter 2] (parameters), theta* as the optimal parameters, SSE as the sum of squared errors, and the F statistic that has 3 arguments (alpha=confidence level, degrees of freedom 1, and degrees of freedom 2). For many problems, this creates a multi-dimensional nonlinear confidence region. In the case of 2 parameters, the nonlinear confidence region is a 2-dimensional space. Below is an example that shows the confidence region for the dye fading experiment confidence region for forward and reverse activation energies.
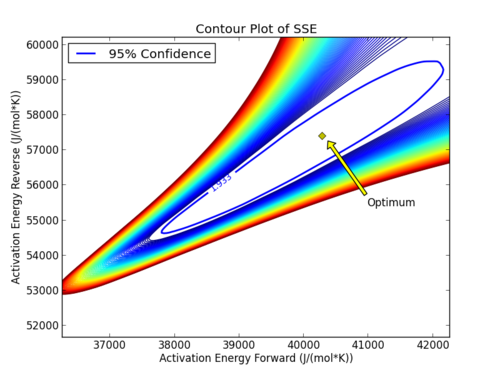
The optimal parameter values are in the 95% confidence region. This plot demonstrates that the 2D confidence region is not necessarily symmetric.
Case Study 2: Ethyl Acetate Kinetics
This assignment contains a kinetic analysis of several experiments using the reaction of Ethyl Acetate with Sodium Hydroxide to produce Ethanol and Sodium Acetate.
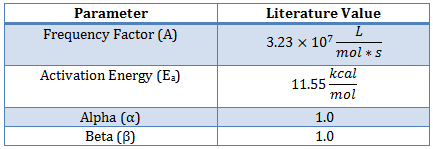
Determine the kinetic parameters for the Ethyl-Acetate/Sodium Hydroxide reaction including the frequency factor (A), reaction orders (α and β), and activation energy (Ea) for the reaction.
This reaction has been studied previously and literature values provide starting values for the parameter estimation1.
The data is obtained by operating a glass reaction vessel with the following supplies:
- Fisher Scientific accumet XL60 pH meter and probe
- Benchtop heat exchanger
- 95.5 wt.% Ethyl Acetate
- Sodium Hydroxide solution
The measured amount of Ethyl Acetate is added to the Sodium Hydroxide solution. The temperature and pH are measured over the course of an hour to record the data for analysis. Download the sample scripts and model files below for a starting point for the dynamic simulation and parameter estimation.
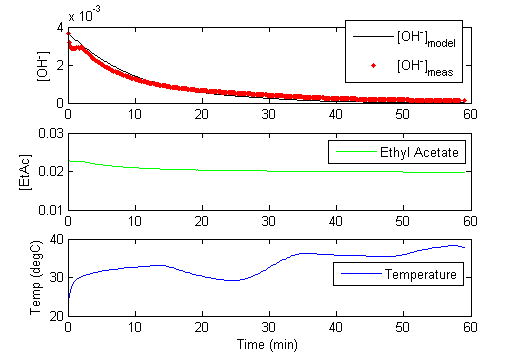
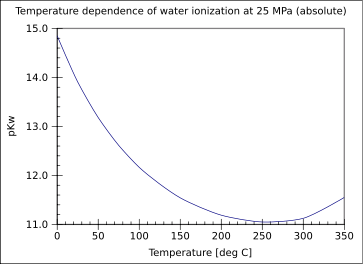
Once the pH is measured, it must be translated into a hydroxide concentration for use in these calculations. The concentration of hydroxide ion is related to the pH as measured by the probe and pKw which is temperature dependent.
More information is contained in the experimental data when the temperature is varied throughout the one hour run. The variable temperature also causes the pKw to change. The self ionization of water as indicated by pKw is dependent on the temperature2,3
Nonlinear Confidence Interval for Ethyl Acetate Kinetics
The above script produces 1-dimensional confidence intervals for all of the reaction parameters. In this example, the reversibility of the reaction is tested by including the reverse reaction rate in the data fit. The optimizer decides whether to assign a sufficiently large reverse reaction rate to optimally fit the model to the dynamic data.
Nonlinear confidence intervals can also be visualized as a function of 2 parameters. In this case, both parameters are simultaneously varied to find the confidence region. The confidence interval is determined with an F-test that specifies an upper limit to the deviation from the optimal solution
with p=2 (number of parameters), n=number of measurements, theta=[parameter 1, parameter 2] (parameters), theta* as the optimal parameters, SSE as the sum of squared errors, and the F statistic that has 3 arguments (alpha=confidence level, degrees of freedom 1, and degrees of freedom 2). For many problems, this creates a multi-dimensional nonlinear confidence region. In the case of 2 parameters, the nonlinear confidence region is a 2-dimensional space.
References
- Laidler, K. J. and Chen, D. (1957). The influence of pressure on the kinetics of the alkaline hydrolysis of esters and amides. Trans. Faraday Soc., 1958,54, 1026-1033, DOI: 10.1039/TF9585401026 View Article
- Whitfield, M. (1975). Chemical Oceanography. In J. P. Riley, & E. Skirrows, Vol. 2 2nd Ed. (pp. 44-171). Academic, New York.
- Wikipedia, Self-ionization of water, URL: https://en.wikipedia.org/wiki/Self-ionization_of_water.