Simulate HIV Infection
 |  | |  |  | | |
|---|
The human immunodeficiency virus (HIV) infection spreads and can develop into acquired immunodeficiency syndrome (AIDS). AIDS can lead to immune system failure and eventual inability to defend the body against infection or cancer. Without treatment with antiretroviral drugs, survival time after infection with HIV is about 9 to 11 years, depending on a number of factors. Antiretroviral drugs such as TDF (tenofovir), either 3TC (lamivudine) or FTC (emtricitabine), and EFV (efavirenz) are recommended by the World Health Organization as soon as HIV infection is diagnosed. This simulation predicts the spread of HIV infection in a body with an initial infection.
The spread of HIV in a patient is approximated with balance equations on (H)ealthy, (I)nfected, and (V)irus population counts.
Initial Conditions
 H(0) = healthy cells = 1,000,000
 I(0) = infected cells = 0
 V(0) = virus = 100
Equations
The equations are transient balances on the number of healthy cells `(H)`, infected cells `(I)`, and virus count `(V)`. Terms on the right side with a positive sign (blue) increase that corresponding number of cells or virus. Likewise, terms with a negative sign (red) decrease the number of cells or virus.
$$\frac{dH(t)}{dt} = \color{blue}{kr_1} \color{red}{- kr_2 H(t) - kr_3 H(t) \; V(t)}$$ $$\frac{dI(t)}{dt} = \color{blue}{kr_3 H(t) \; V(t)} \color{red}{- kr_4 I(t)}$$ $$\frac{dV(t)}{dt} = \color{red}{-kr_3 H(t) \; V(t) - kr_5 V(t)} \color{blue}{+ kr_6 I(t)}$$
There are six parameters (kr1..6) in the model that provide the rates of cell death, infection spread, virus replication, and other processes that determine the spread of HIV in the body.
Parameters
 kr1 = 1e5 = new healthy cells per year
 kr2 = 0.1 = death rate of healthy cells
 kr3 = 2e-7 = healthy cells converting to infected cells
 kr4 = 0.5 = death rate of infected cells
 kr5 = 5 = death rate of virus
 kr6 = 100 = production of virus by infected cells
Simulate the healthy, infected, and virus count over the course of 15 years if no treatment such as an anti-retroviral is taken. See the introduction on using ODEINT for simulating ODEs.
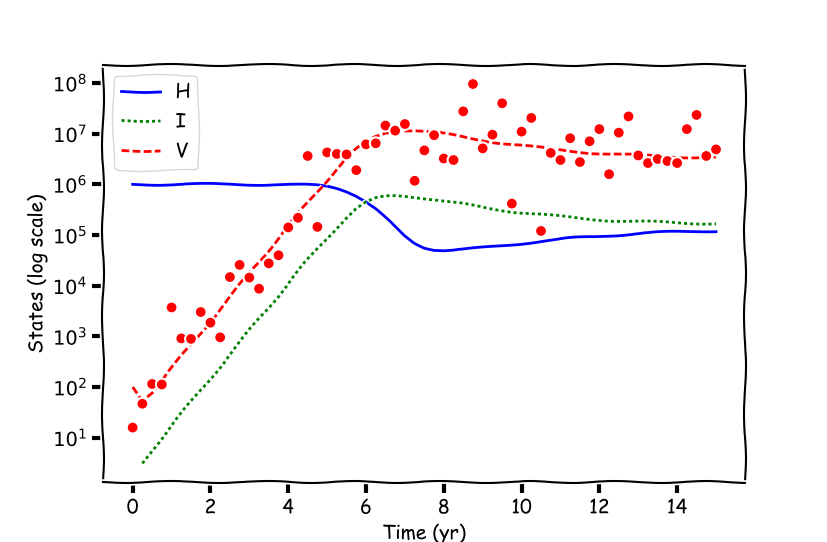
The sketch also includes patient data. The final report should include:
- A semi-log-y plot that shows the progress of infection such as the sketch above.
- Discuss what terms you would adjust to match HIV lab data that measures the virus in a patient.
- Suppose that a new antiretroviral drug is evaluated in clinical trials. Virus count data is collected over many years to control the HIV infection. Discuss what terms could be added to the differential equations to include the effect of an antiretroviral drug.
References
Nowak, M. and May, R. M. Virus dynamics: mathematical principles of immunology and virology: mathematical principles of immunology and virology. Oxford university press, 2000.
Model Initialization Strategies: HIV Case Study Exercise, Dynamic Optimization Course, 2017, Course Link.
Simulating Control of HIV Infection with Antiretroviral Drugs, Process Control Projects, 2011-15. YouTube Playlist.
Solution
TCLab Exercise
See TCLab Step Test