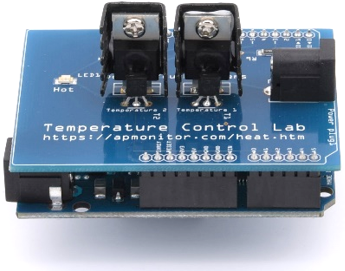
TCLab FOPDT Model
 |  | | |  |  |  |
|---|
Objective: Collect step response data from the TCLab and compute parameters of an FOPDT model.
A first order plus dead time (FOPDT) model of the Temperature Control Lab (TCLab) is the following:
$$\tau_p \frac{dT'}{dt} = -T' + K_p \, Q'\left(t-\theta_p\right)$$
where `T'=T-T_{ss}` and `Q'=Q-Q_{ss}` are deviation variables with steady-state initial conditions `T_{ss}=23^oC` and `Q_{ss}=0 \%`. Perform a step test with heater 1 starting at 0% for 0.5 minutes (30 seconds) and then step the heater to 70% for 7.5 minutes. Create a plot of the temperature response over 8 minutes that also shows the heater level (%). Sample source code for generating the response is provided below.
import matplotlib.pyplot as plt
import tclab
import time
n = 480 # Number of second time points (8 min)
tm = np.linspace(0,n,n+1) # Time values
# data
lab = tclab.TCLab()
T1 = [lab.T1]
Q1 = np.zeros(n+1)
Q1[30:] = 70.0
for i in range(n):
lab.Q1(Q1[i])
time.sleep(1)
print(lab.T1)
T1.append(lab.T1)
lab.close()
# Create Figure
plt.figure(figsize=(12,8))
ax = plt.subplot(2,1,1)
ax.grid()
plt.plot(tm/60.0,T1,'r.',label=r'$T_1$')
plt.ylabel(r'Temp ($^oC$)')
ax = plt.subplot(2,1,2)
ax.grid()
plt.plot(tm/60.0,Q1,'b-',label=r'$Q_1$')
plt.ylabel(r'Heater (%)')
plt.xlabel('Time (min)')
plt.legend()
plt.savefig('Step_Response.png')
plt.show()
Open the TCLab web interface or run the script with the TCLab device connected to generate the figure Step_Response.png. Use the figure to calculate the values of `K_p`, `\tau_p`, and `\theta_p` as shown in the procedure for graphical fitting of FOPDT models. Specify units for each of the parameters.
Solution