Estimate Ethyl Acetate Kinetic Parameters from Dynamic Data
Dynamic Parameter Estimation
This assignment contains a kinetic analysis of several experiments using the reaction of Ethyl Acetate with Sodium Hydroxide to produce Ethanol and Sodium Acetate.
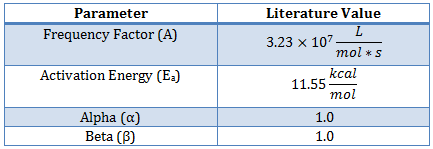
Determine the kinetic parameters for the Ethyl-Acetate/Sodium Hydroxide reaction including the frequency factor (A), reaction orders (α and β), and activation energy (Ea) for the reaction.
This reaction has been studied previously and literature values provide starting values for the parameter estimation1.
The data is obtained by operating a glass reaction vessel with the following supplies:
- Fisher Scientific accumet XL60 pH meter and probe
- Benchtop heat exchanger
- 95.5 wt.% Ethyl Acetate
- Sodium Hydroxide solution
The measured amount of Ethyl Acetate is added to the Sodium Hydroxide solution. The temperature and pH are measured over the course of an hour to record the data for analysis. Download the sample scripts and model files below for a starting point for the dynamic simulation and parameter estimation.

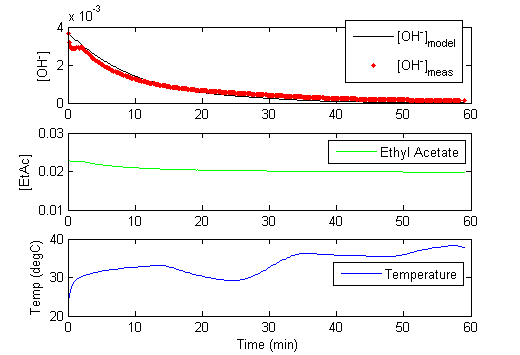
Once the pH is measured, it must be translated into a hydroxide concentration for use in these calculations. The concentration of hydroxide ion is related to the pH as measured by the probe and pKw which is temperature dependent.
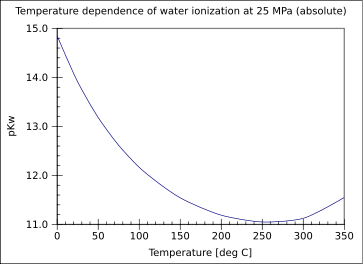
More information is contained in the experimental data when the temperature is varied throughout the one hour run. The variable temperature also causes the pKw to change. The self ionization of water as indicated by pKw is dependent on the temperature2,3
Nonlinear Confidence Intervals
The above script produces 1-dimensional confidence intervals for all of the reaction parameters. In this example, the reversibility of the reaction is tested by including the reverse reaction rate in the data fit. The optimizer decides whether to assign a sufficiently large reverse reaction rate to optimally fit the model to the dynamic data.
Nonlinear confidence intervals can also be visualized as a function of 2 parameters. In this case, both parameters are simultaneously varied to find the confidence region. The confidence interval is determined with an F-test that specifies an upper limit to the deviation from the optimal solution
with p=2 (number of parameters), n=number of measurements, theta=[parameter 1, parameter 2] (parameters), theta* as the optimal parameters, SSE as the sum of squared errors, and the F statistic that has 3 arguments (alpha=confidence level, degrees of freedom 1, and degrees of freedom 2). For many problems, this creates a multi-dimensional nonlinear confidence region. In the case of 2 parameters, the nonlinear confidence region is a 2-dimensional space. See the Dye Fading Experiment for an example of a 2D nonlinear confidence region.
References
