Fired Heater Simulation and Control
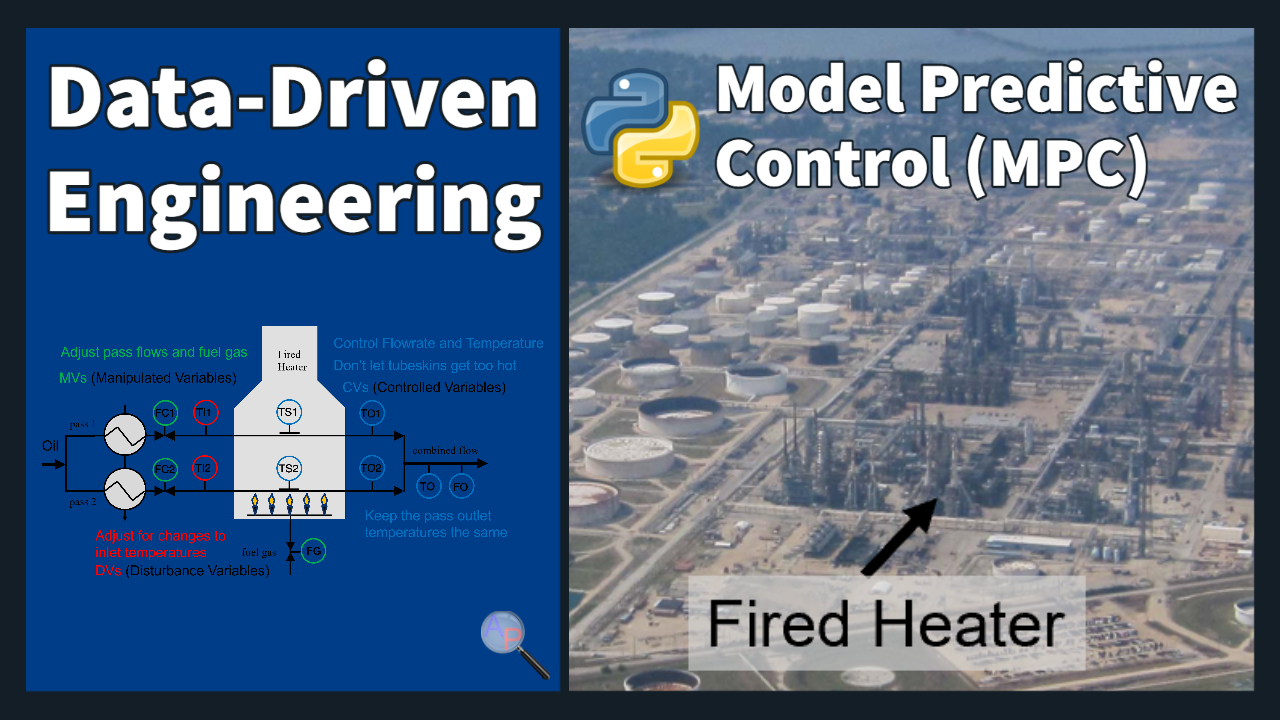
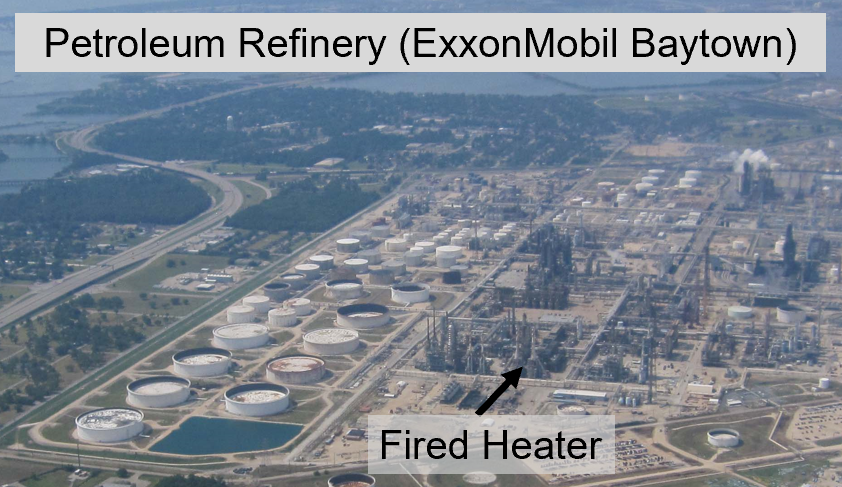
A fired heater is located at the front-end of a refinery to heat and vaporize the feed oil so that it can be separated by fractionation. Because this operation controls the feed to the refinery, it directly affects how much product is refined. In a typical application of this type, a 1% increase in heater throughput has a benefit of $2M per year in economic benefit.
The fired heater burns fuel to raise the temperature of process fluid in a complex tube path with conductive, convective, and radiative heat transfer. The waste combustion gases from the burned fuel leave the fired heater through an overhead stack.
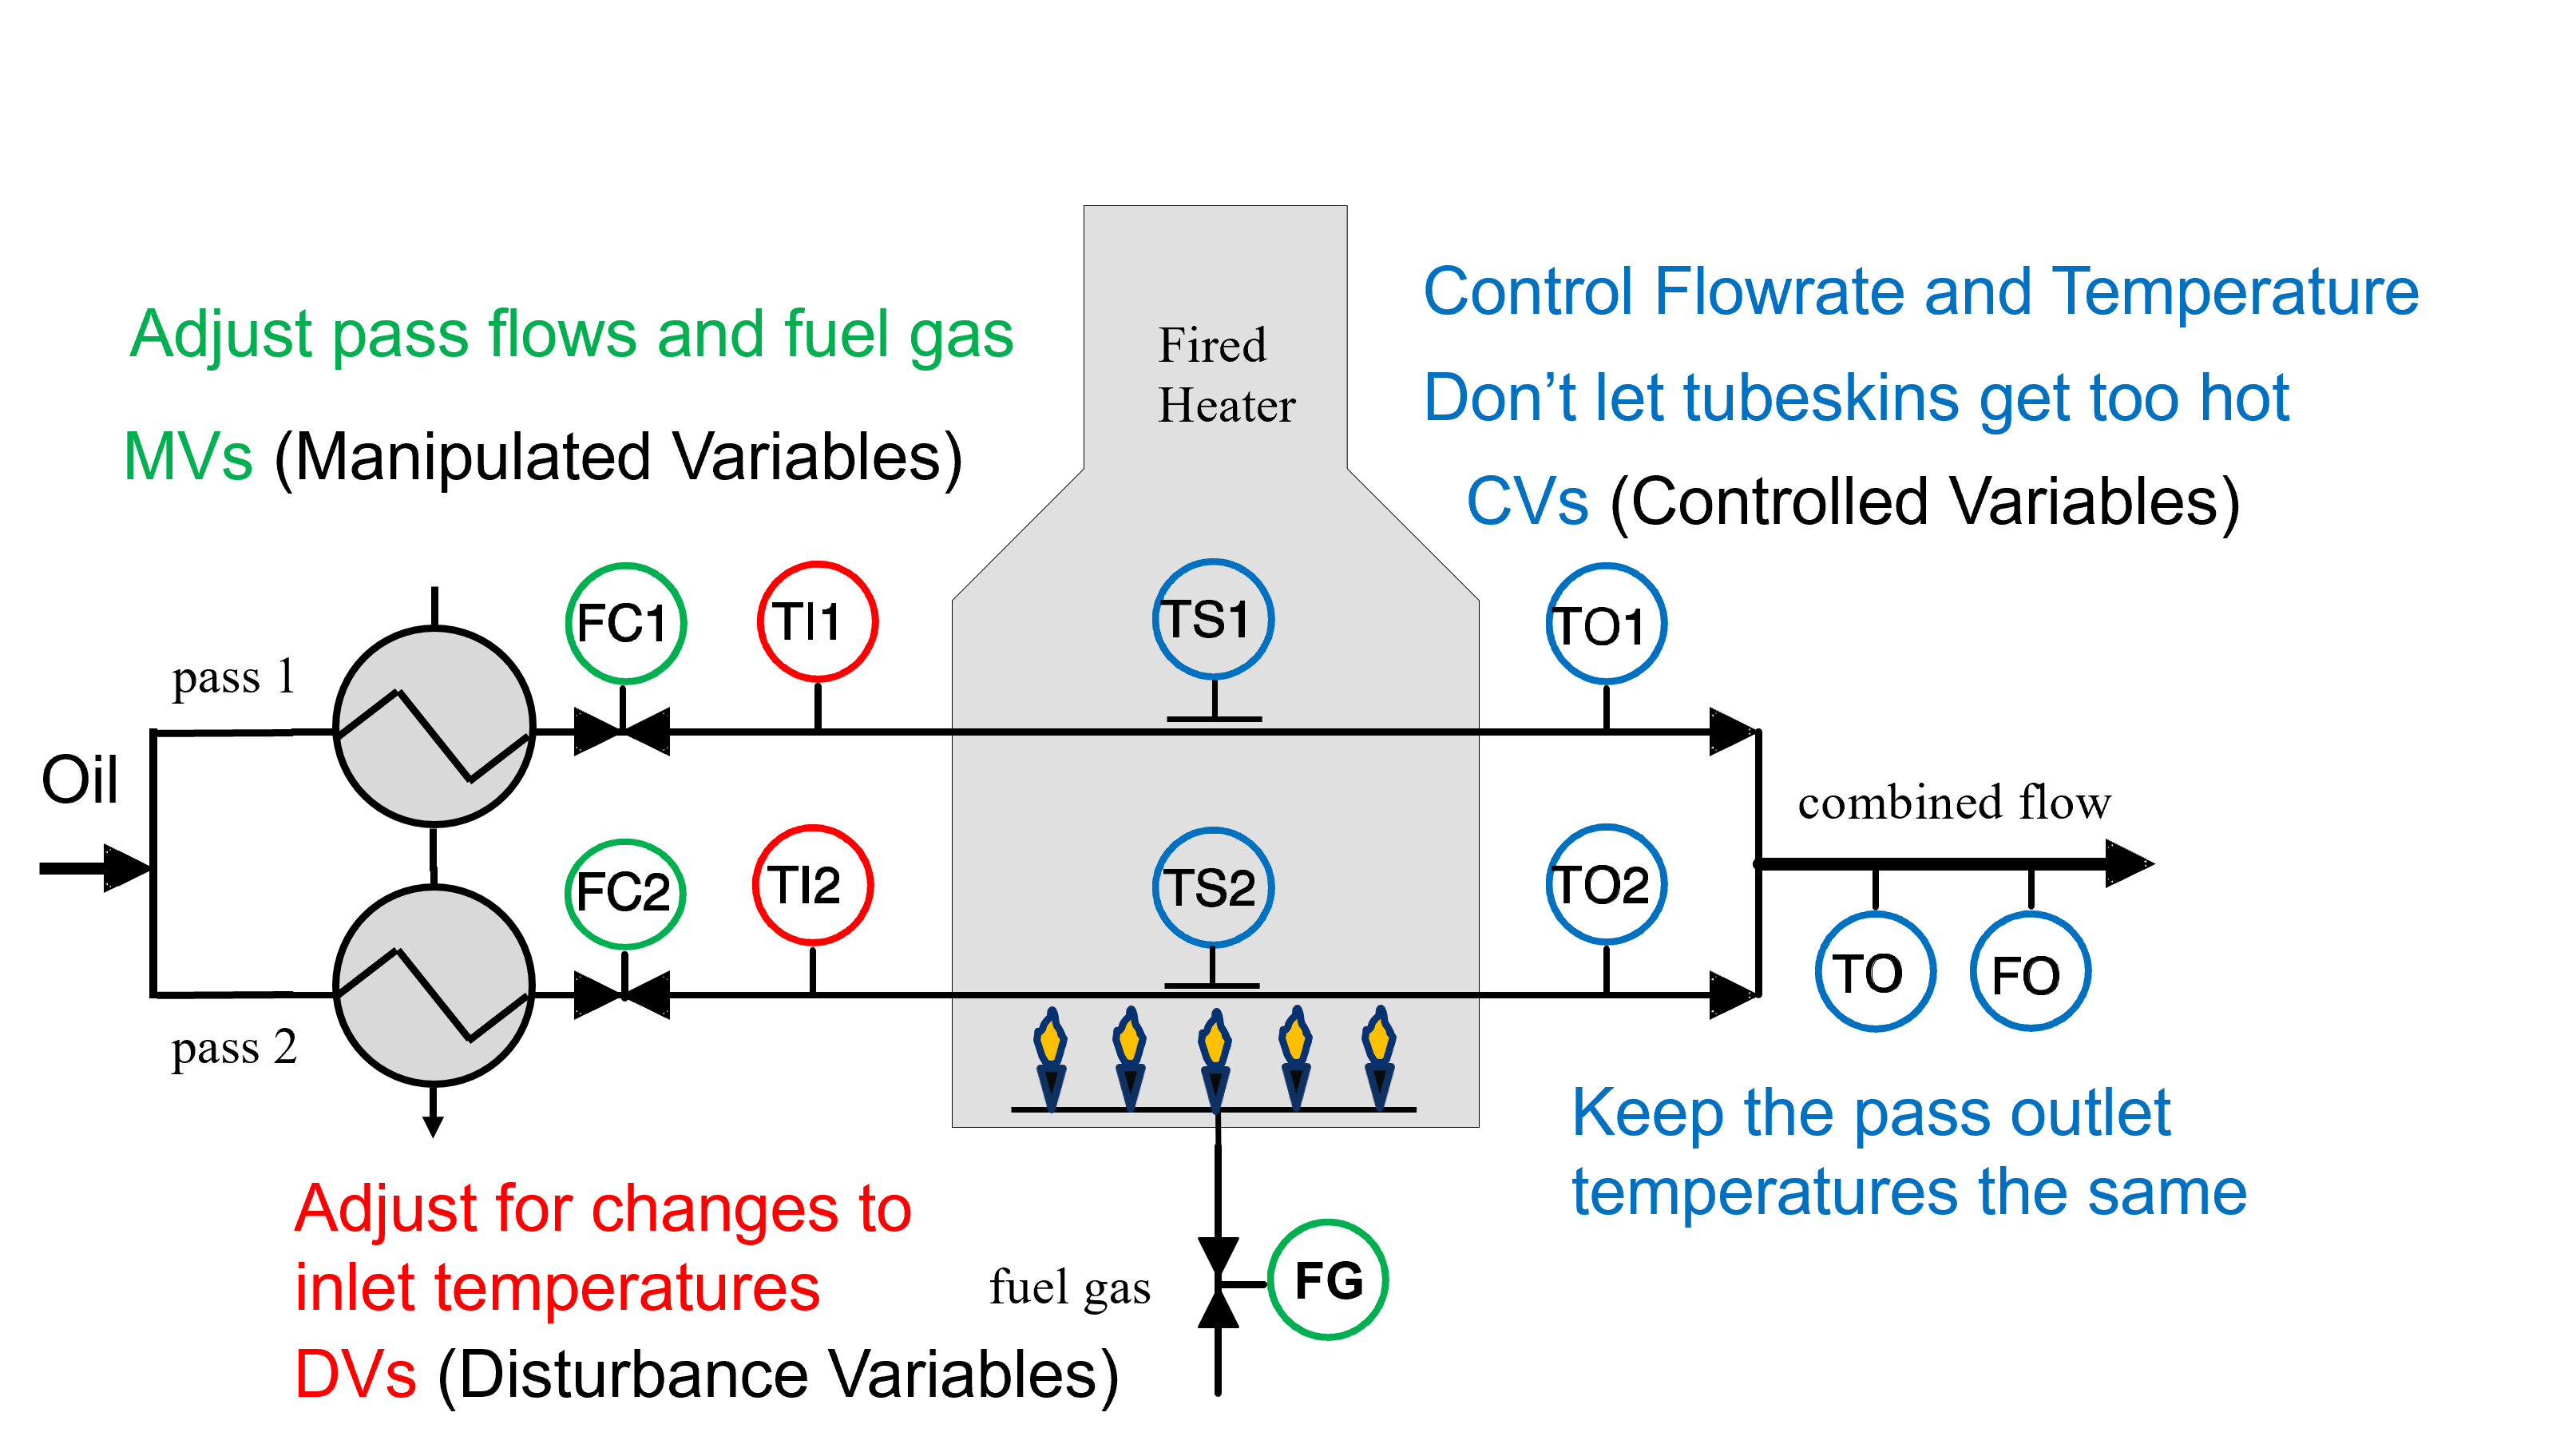
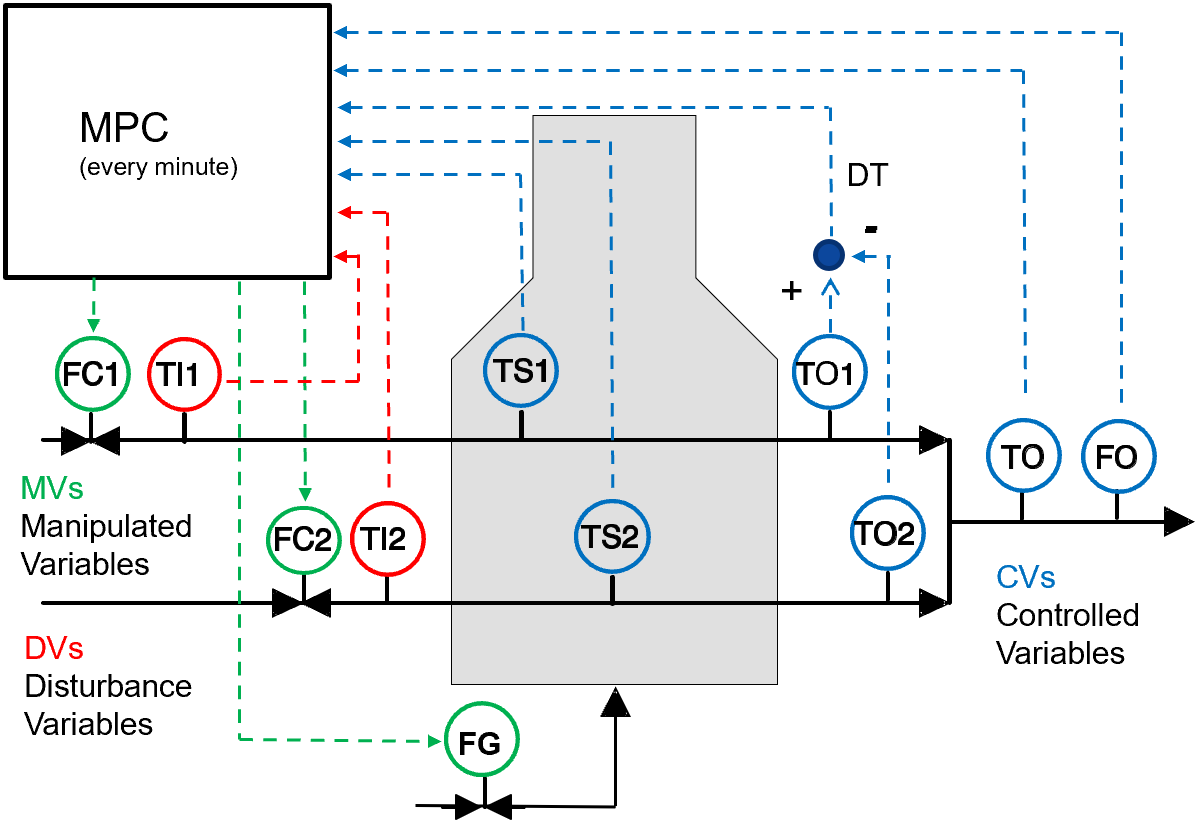
This fired heater case study is a simplified simulation of a typical process to regulate temperature and fluid flow. The fired heater is simulated as a linear dynamic model with five inputs and five outputs. The inputs are the two flow controllers (FC1 and FC2), fuel gas (FG) flow, inlet temperatures (TI1 and TI2). The inputs include three manipulated variables and two disturbances. The manipulated variables are valves that can be adjustable and are indicated with red circles. The disturbance variables are measured but not adjustable and are indicated with red circles. The outputs are the tube skin temperatures (TS1 and TS2), two outlet temperatures (TO1 and TO2), and combined outlet temperature (TO) and combined outlet flow (FO). The outputs are indicated with blue circles.
The next step is to develop a mathematical model that predicts the effects of MV and DV changes on the CVs after laying out the MPC design specification. Most industrial MPC applications rely on a linear empirical MIMO model developed from process step response data. The controlled variables are TO, FO, TS1, TS2, and a difference between TO1 and TO2. Each controlled variable has either a target value or an acceptable range with an associated priority. Each input affects multiple outputs with a Multiple Input Multiple Output (MIMO) relationship.
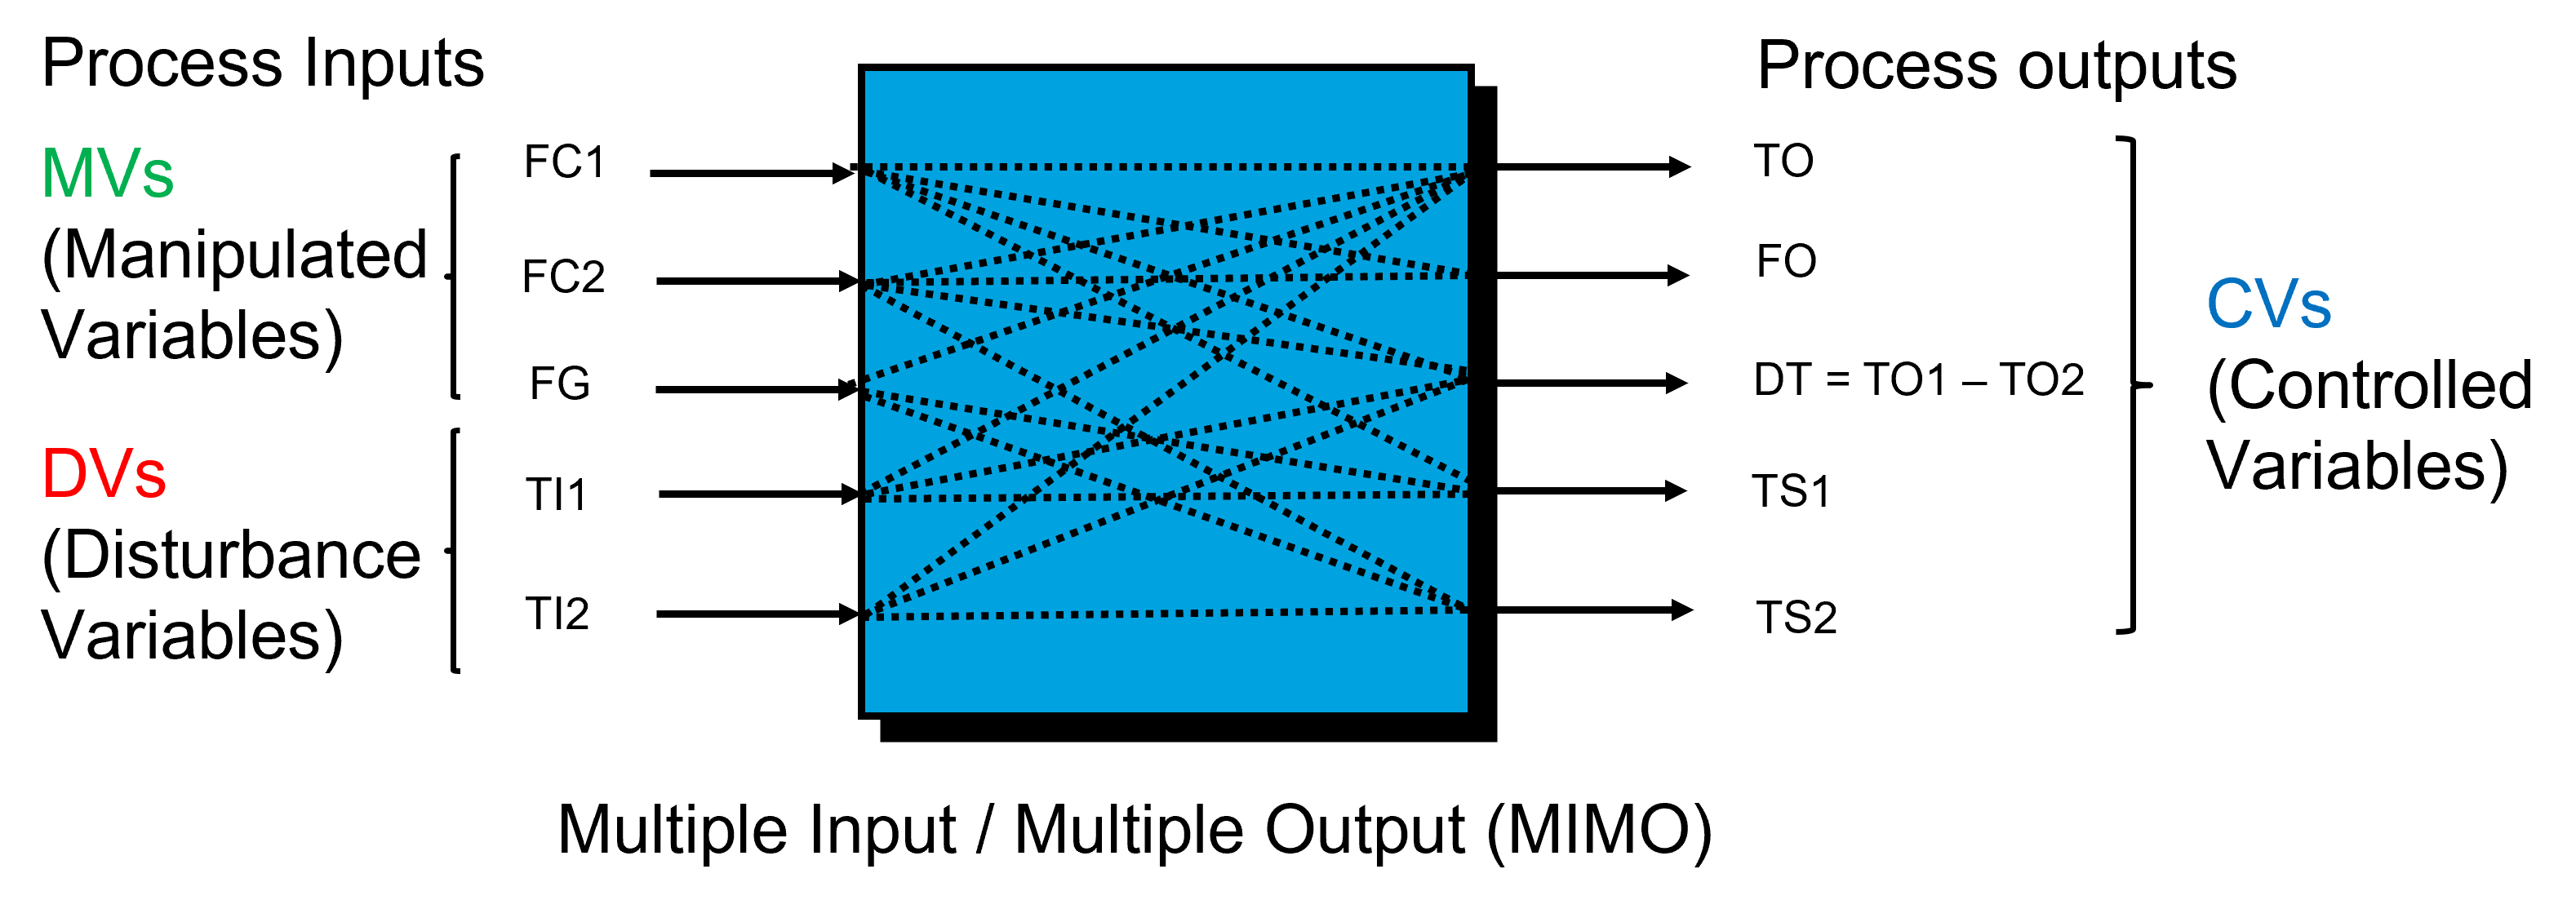
Each input to output relationship has either no effect, a first order response, or a second order underdamped response. The LaPlace transforms for each input to output pair are shown below.
$$\begin{align}&\begin{bmatrix}TO\\FO\\DT\\TS1\\TS2\end{bmatrix}=\\& \begin{bmatrix} \frac{-0.8}{(s+1)(2s+1)} & \frac{-0.8}{(s+1)(2s+1)} & \frac{6}{(s+1)(3s+1)} & \frac{0.35}{(s+1)(2s+1)} & \frac{0.35}{(s+1)(2s+1)}\\ \frac{1}{2s+1} & \frac{1}{2s+1} & 0 & 0 & 0\\ \frac{-1}{(10s+1)(15s+1)} & \frac{1}{(10s+1)(15s+1)} & 0 & \frac{0.4}{(s+1)(2s+1)} & \frac{0.4}{(s+1)(2s+1)}\\ \frac{-1.2}{s+1} & 0 & \frac{10}{(s+1)(2s+1)} & \frac{0.8}{s+1} & 0\\ 0 & \frac{-1.2}{s+1} & \frac{10}{(s+1)(2s+1)} & 0 & \frac{0.8}{s+1} \end{bmatrix}\begin{bmatrix}FC1\\FC2\\FG\\TI1\\TI2\end{bmatrix}\end{align}$$
% This script builds a continuous 5x5 multivariable fired heater
%
% process inputs:
%
% 1. pass flow #1 setpoint (BPH)
% 2. pass flow #2 setpoint (BPH)
% 3. fuel gas flow setpoint (SCFH)
%
% process disturbances:
%
% 1. pass #1 inlet temperature (DEGF)
% 2. pass #2 inlet temperature (DEGF)
%
% process outputs:
%
% 1. combined outlet temperature (DEGF)
% 2. combined outlet flowrate (BPH)
% 3. pass temp diff (1 - 2) (DEGF)
% 4. pass 1 tubeskin temperature (DEGF)
% 5. pass 2 tubeskin temperature (DEGF)
%
%--------------------------------------------------------------------
% Build the transfer functions for outlet temp
num11 = [-0.8];
den11 = conv([1 1],[2 1]);
num12 = [-0.8];
den12 = conv([1 1],[2 1]);
num13 = [6.0];
den13 = conv([1 1],[3 1]);
num14 = [0.35];
den14 = conv([1 1],[2 1]);
num15 = [0.35];
den15 = conv([1 1],[2 1]);
% Build the transfer functions for outlet flow
num21 = [1.0];
den21 = [2 1];
num22 = [1.0];
den22 = [2 1];
% Build the transfer functions for delta T
num31 = [-1.0];
den31 = conv([10 1],[15 1]);
num32 = [1.0];
den32 = conv([10 1],[15 1]);
num34 = [0.4];
den34 = conv([1 1],[2 1]);
num35 = [-0.4];
den35 = conv([1 1],[2 1]);
% Build the transfer function for TS1
num41 = [-1.2];
den41 = [1 1];
num43 = [10];
den43 = conv([1 1],[2 1]);
num44 = [0.8];
den44 = [1 1];
% Build the transfer function for TS2
num52 = [-1.2];
den52 = [1 1];
num53 = [10];
den53 = conv([1 1],[2 1]);
num55 = [0.8];
den55 = [1 1];
Construct individual continuous state space systems for each
transfer function.
[a11,b11,c11,d11] = tf2ss(num11,den11);
[a12,b12,c12,d12] = tf2ss(num12,den12);
[a13,b13,c13,d13] = tf2ss(num13,den13);
[a14,b14,c14,d14] = tf2ss(num14,den14);
[a15,b15,c15,d15] = tf2ss(num15,den15);
[a21,b21,c21,d21] = tf2ss(num21,den21);
[a22,b22,c22,d22] = tf2ss(num22,den22);
[a31,b31,c31,d31] = tf2ss(num31,den31);
[a32,b32,c32,d32] = tf2ss(num32,den32);
[a34,b34,c34,d34] = tf2ss(num34,den34);
[a35,b35,c35,d35] = tf2ss(num35,den35);
[a41,b41,c41,d41] = tf2ss(num41,den41);
[a43,b43,c43,d43] = tf2ss(num43,den43);
[a44,b44,c44,d44] = tf2ss(num44,den44);
[a52,b52,c52,d52] = tf2ss(num52,den52);
[a53,b53,c53,d53] = tf2ss(num53,den53);
[a55,b55,c55,d55] = tf2ss(num55,den55);
% Set the deadtimes and sample time of 1 minute.
Ts = 1;
% Construct the system A matrix
AD = [];
aZ = 0;
AD = dgapp(AD,a11);
AD = dgapp(AD,a12);
AD = dgapp(AD,a13);
AD = dgapp(AD,a14);
AD = dgapp(AD,a15);
AD = dgapp(AD,a21);
AD = dgapp(AD,a22);
AD = dgapp(AD,aZ);
AD = dgapp(AD,aZ);
AD = dgapp(AD,aZ);
AD = dgapp(AD,a31);
AD = dgapp(AD,a32);
AD = dgapp(AD,aZ);
AD = dgapp(AD,a34);
AD = dgapp(AD,a35);
AD = dgapp(AD,a41);
AD = dgapp(AD,aZ);
AD = dgapp(AD,a43);
AD = dgapp(AD,a44);
AD = dgapp(AD,aZ);
AD = dgapp(AD,aZ);
AD = dgapp(AD,a52);
AD = dgapp(AD,a53);
AD = dgapp(AD,aZ);
AD = dgapp(AD,a55);
% Construct the system B matrix
BD = [];
bZ = 0;
BD = dgapp(BD,b11);
BD = dgapp(BD,b12);
BD = dgapp(BD,b13);
BD = dgapp(BD,b14);
BD = dgapp(BD,b15);
BD = dgapp(BD,b21);
BD = dgapp(BD,b22);
BD = dgapp(BD,bZ);
BD = dgapp(BD,bZ);
BD = dgapp(BD,bZ);
BD = dgapp(BD,b31);
BD = dgapp(BD,b32);
BD = dgapp(BD,bZ);
BD = dgapp(BD,b34);
BD = dgapp(BD,b35);
BD = dgapp(BD,b41);
BD = dgapp(BD,bZ);
BD = dgapp(BD,b43);
BD = dgapp(BD,b44);
BD = dgapp(BD,bZ);
BD = dgapp(BD,bZ);
BD = dgapp(BD,b52);
BD = dgapp(BD,b53);
BD = dgapp(BD,bZ);
BD = dgapp(BD,b55);
IM = [];
Inu = eye(5);
for i = 1:5
IM = [IM ; Inu];
end
BD = BD*IM;
% Construct the system C matrix
cZ = 0;
CD1 = [c11 c12 c13 c14 c15];
CD2 = [c21 c22 cZ cZ cZ ];
CD3 = [c31 c32 cZ c34 c35];
CD4 = [c41 cZ c43 c44 cZ ];
CD5 = [cZ c52 c53 cZ c55];
CD = [ ];
CD = dgapp(CD,CD1);
CD = dgapp(CD,CD2);
CD = dgapp(CD,CD3);
CD = dgapp(CD,CD4);
CD = dgapp(CD,CD5);
% Construct the system D matrix
dZ = 0;
DD1 = [d11 d12 d13 d14 d15];
DD2 = [d21 d22 dZ dZ dZ ];
DD3 = [d31 d32 dZ d34 d35];
DD4 = [d41 dZ d43 d44 dZ ];
DD5 = [dZ d52 d53 dZ d55];
DD = [DD1;DD2;DD3;DD4;DD5];
disp(size(AD))
disp(size(BD))
disp(size(CD))
disp(size(DD))
% Get a minimal realization
[A,B,C,D] = minreal(AD,BD,CD,DD);
% Build heater state space model
heater = ss(A,B,C,D);
heater.OutputName = {'TO.PV','FO.PV','DT.PV','TS1.PV','TS2.PV'};
heater.OutputUnit = {'DEGF','BPH','DEGF','DEGF','DEGF'};
heater.InputName = {'FC1.SP','FC2.SP','FG.SP','TI1.PV','TI2.PV'};
heater.InputUnit = {'BPH','BPH','MSCFH','DEGF','DEGF'};
heater.TimeUnit = 'minutes';
save('A.txt','A','-ascii')
save('B.txt','B','-ascii')
save('C.txt','C','-ascii')
save('D.txt','D','-ascii')
sAD = sparse(AD);
sBD = sparse(BD);
sCD = sparse(CD);
sDD = sparse(DD);
[row, col, v] = find(sAD);
M = [row, col, v];
save('sA.txt','M', '-ascii', '-tabs');
[row, col, v] = find(sBD);
M = [row, col, v];
save('sB.txt','M', '-ascii', '-tabs');
[row, col, v] = find(sCD);
M = [row, col, v];
save('sC.txt','M', '-ascii', '-tabs');
[row, col, v] = find(sDD);
M = [row, col, v];
save('sD.txt','M', '-ascii', '-tabs');
% Plot the system step response
step(heater,100)
grid
save('HeaterModelCont','A','B','C','D')
The outputs include temperatures and flows that are important to maintain safety and the operational integrity of the system.
The Controlled Variables (CVs) have target values or limits that should not be exceeded. The CVs are the outputs of the simulation that cannot be manipulated directly but are the result of process disturbances and actuators that adjust the process. The priority is the ranked order of importance for meeting that target or staying within the limit. The Manipulated Variables (MVs) are the actuators of the process such as valves and pumps. The actuators in this case are the flow controllers of the fuel gas and inlet fluid flow for each tube. There is a secondary controller that adjusts the flow directly so the MVs are the setpoints to each flow controller. Disturbance Variables (DVs) are similar to MVs but they are measured but not adjustable. The DVs are the inlet fluid temperatures.
The fired heater MPC design specification is presented in the Table below as a list of the key process variables and corresponding specifications. A vital aspect of the MPC design is the requirement to prioritize the CVs. This is done to make sure that the control focuses first on the most important goals, and then tries to achieve remaining goals in a prioritized order only if enough degrees of freedom are available. The highest priority specifications involve constraints associated with safety. Lower-level priorities typically include meeting desired product specifications and saving energy. For the fired heater example, the top priority is to make sure that tube skin temperatures TS1 and TS2 do not exceed a maximum safety limit. The second and third priorities are to achieve the desired combined oil outlet temperature and flowrate. A fourth priority, when conditions allow, is to balance the tube outlet temperatures TO1 and TO2 in order to maximize heat transfer efficiency, and to prevent one of the tubes from getting too hot and coking up. For this purpose, a delta temperature variable DT is defined as the difference between the tube 1 and 2 oil outlet temperatures (TO1 and TO2). Maximum, minimum, and rate of change limits are provided for each MV. These do not have an associated priority because they can always be enforced by the commands sent to the valves.
| Variable | Description (Units) | Type | Priority | Specification |
|---|---|---|---|---|
| TS1 | Tube 1 skin temperature (°F) | CV | 1 | Max Limit |
| TS2 | Tube 2 skin temperature (°F) | CV | 1 | Max Limit |
| TO | Combined outlet temperature (°F) | CV | 2 | Target Value |
| FO | Combined outlet flow rate (BPH) | CV | 3 | Target Value |
| TO1 | Tube 1 outlet temperature (°F) | |||
| TO2 | Tube 2 outlet temperature (°F) | |||
| DT | Δ Temperature TO1-TO2 (°F) | CV | 4 | Target 0 |
| FC1 | Tube 1 flow setpoint (BPH) | MV | Min/Max/Change | |
| FC2 | Tube 2 flow setpoint (BPH) | MV | Min/Max/Change | |
| FG | Fuel gas flow setpoint (MSCFH) | MV | Min/Max/Change | |
| TI1 | Tube 1 inlet temperature (°F) | DV | ||
| TI2 | Tube 2 inlet temperature (°F) | DV |
A state space model is a linear representation of the fired heater system. A continuous state space model is described in more detail in the State Space Introduction.
$$\dot x = A x + B u$$
$$y = C x + D u$$
The dimensions of each matrix are shown below with `n_u` inputs, `n_x` states, and `n_y` outputs.
$$A \in \mathbb{R}^{36 \, \mathrm{x} \, 36}$$ $$B \in \mathbb{R}^{36 \, \mathrm{x} \, 5}$$ $$C \in \mathbb{R}^{5 \, \mathrm{x} \, 36}$$ $$D \in \mathbb{R}^{5 \, \mathrm{x} \, 5}$$
The matrices are stored in sparse form with row, column, and value entries.
# state space matrices A,B,C
# sparse (row,column,value)
A = np.array(\
[[1,1,-1.5],[2,1,1.0],[1,2,-0.5],[3,3,-1.5],\
[4,3,1.0],[3,4,-0.5],[5,5,-1.3333333],[6,5,1.0],\
[5,6,-.33333333],[7,7,-1.5],[8,7,1.0],\
[7,8,-0.5],[9,9,-1.5],[10,9,1.0],[9,10,-0.5],\
[11,11,-0.5],[12,12,-0.5],[16,16,-0.16666667],\
[17,16,1.0],[16,17,-6.6666667e-03],\
[18,18,-0.16666667],[19,18,1.0],\
[18,19,-6.6666667e-03],[21,21,-1.5],\
[22,21,1.0],[21,22,-0.5],[23,23,-1.5],\
[24,23,1.0],[23,24,-0.5],[25,25,-1.0],\
[27,27,-1.5],[28,27,1.0],[27,28,-0.5],\
[29,29,-1.0],[32,32,-1.0],[33,33,-1.5],\
[34,33,1.0],[33,34,-0.5],[36,36,-1.0]])
B = np.array(\
[[1,1,1],[11,1,1],[16,1,1],[25,1,1],[3,2,1],\
[12,2,1],[18,2,1],[32,2,1],[5,3,1],[27,3,1],\
[33,3,1],[7,4,1],[21,4,1],[29,4,1],[9,5,1],\
[23,5,1],[36,5,1]])
C = np.array(\
[[1,2,-0.4],[1,4,-0.4],[1,6,2],[1,8,0.175],\
[1,10,0.175],[2,11,0.5],[2,12,0.5],\
[3,17,-6.6666667e-03],[3,19,6.6666667e-03],\
[3,22,0.2],[3,24,-0.2],[4,25,-1.2],[4,28,5],\
[4,29,0.8],[5,32,-1.2],[5,34,5],[5,36,0.8]])
Only the non-zero values are listed. The first two rows and columns of matrix A are shown below.
$$A = \begin{bmatrix}-1.5 & -0.5 & \cdots\\ 1.0 & 0.0 & \cdots\\ \vdots & \vdots & \ddots \end{bmatrix}$$
The non-zero values in the 2x2 area are:
 [1,1,-1.5]
 [2,1,1.0]
 [1,2,-0.5]
Python uses zero-index so 1 is removed from each row and column index. The matrices are converted to sparse form and then to dense form.
# convert one-index to zero-index
A[:,0:2] += -1
B[:,0:2] += -1
C[:,0:2] += -1
# read and convert sparse matrix
A = csr_matrix((A[:,2],(A[:,0],A[:,1])),shape=(36,36))
B = csr_matrix((B[:,2],(B[:,0],B[:,1])),shape=(36,5))
C = csr_matrix((C[:,2],(C[:,0],C[:,1])),shape=(5,36))
# convert sparse to dense matrix
A = csr_matrix(A).todense()
B = csr_matrix(B).todense()
C = csr_matrix(C).todense()
D = None
The names, units, and initial conditions are listed for each of the five inputs and five outputs.
# outputs
yn = ['TO.PV','FO.PV','DT.PV','TS1.PV','TS2.PV']
yu = ['DEGF','BPH','DEGF','DEGF','DEGF']
y0 = [750,200,0,882,882]
# inputs
un = ['FC1.SP','FC2.SP','FG.SP','TI1.PV','TI2.PV']
uu = ['BPH','BPH','MSCFH','DEGF','DEGF']
u0 = [100,100,95,540,540]
The state space matrices create a system model with Python Gekko for simulation, estimation, and control.
from gekko import GEKKO
m = GEKKO(remote=False)
x,y,u = m.state_space(A,B,C,D=None)

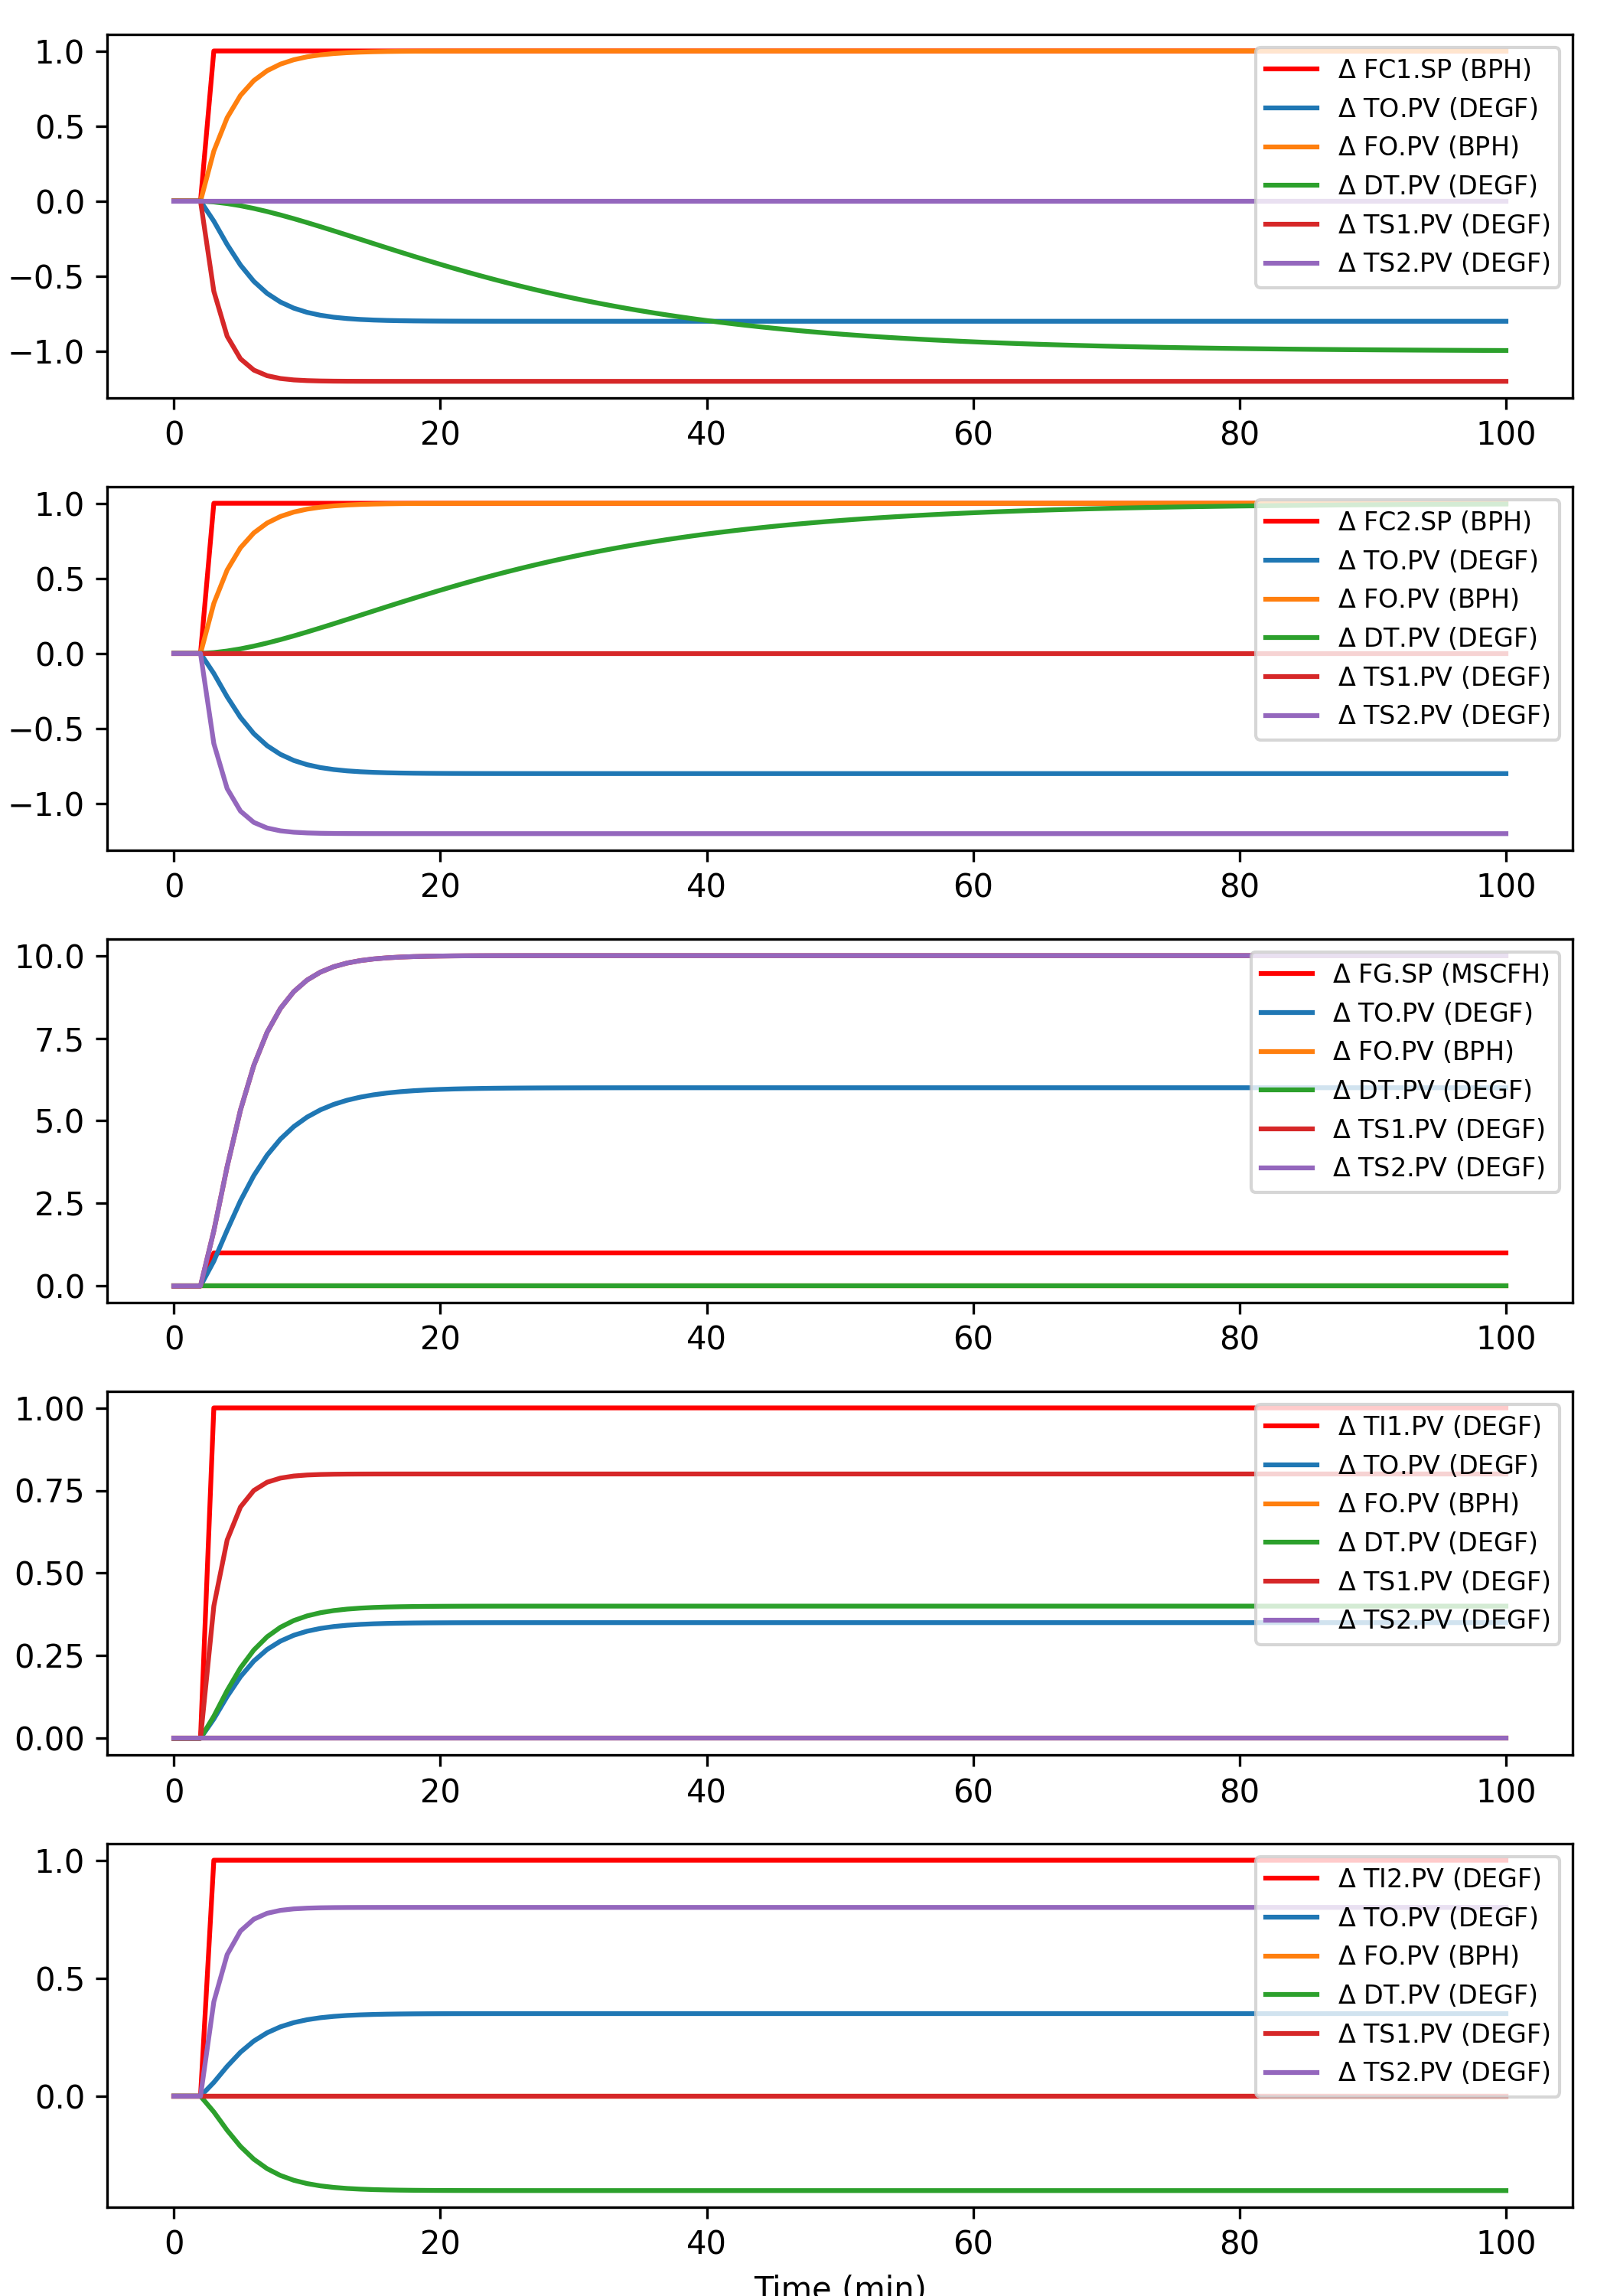
Activity: Step Tests
Simulate a step test of the fired heater for each of the five inputs. Create a plot of each step test that shows the change of each output. A step response is shown below with the first input changed by +1 at 3 minutes.
from gekko import GEKKO
from scipy.sparse import csr_matrix
import matplotlib.pyplot as plt
# state space matrices A,B,C
# sparse (row,column,value)
A = np.array(\
[[1,1,-1.5],[2,1,1.0],[1,2,-0.5],[3,3,-1.5],\
[4,3,1.0],[3,4,-0.5],[5,5,-1.3333333],[6,5,1.0],\
[5,6,-.33333333],[7,7,-1.5],[8,7,1.0],\
[7,8,-0.5],[9,9,-1.5],[10,9,1.0],[9,10,-0.5],\
[11,11,-0.5],[12,12,-0.5],[16,16,-0.16666667],\
[17,16,1.0],[16,17,-6.6666667e-03],\
[18,18,-0.16666667],[19,18,1.0],\
[18,19,-6.6666667e-03],[21,21,-1.5],\
[22,21,1.0],[21,22,-0.5],[23,23,-1.5],\
[24,23,1.0],[23,24,-0.5],[25,25,-1.0],\
[27,27,-1.5],[28,27,1.0],[27,28,-0.5],\
[29,29,-1.0],[32,32,-1.0],[33,33,-1.5],\
[34,33,1.0],[33,34,-0.5],[36,36,-1.0]])
B = np.array(\
[[1,1,1],[11,1,1],[16,1,1],[25,1,1],[3,2,1],\
[12,2,1],[18,2,1],[32,2,1],[5,3,1],[27,3,1],\
[33,3,1],[7,4,1],[21,4,1],[29,4,1],[9,5,1],\
[23,5,1],[36,5,1]])
C = np.array(\
[[1,2,-0.4],[1,4,-0.4],[1,6,2],[1,8,0.175],\
[1,10,0.175],[2,11,0.5],[2,12,0.5],\
[3,17,-6.6666667e-03],[3,19,6.6666667e-03],\
[3,22,0.2],[3,24,-0.2],[4,25,-1.2],[4,28,5],\
[4,29,0.8],[5,32,-1.2],[5,34,5],[5,36,0.8]])
# convert one-index to zero-index
A[:,0:2] += -1
B[:,0:2] += -1
C[:,0:2] += -1
# read and convert sparse matrix
A = csr_matrix((A[:,2],(A[:,0],A[:,1])),shape=(36,36))
B = csr_matrix((B[:,2],(B[:,0],B[:,1])),shape=(36,5))
C = csr_matrix((C[:,2],(C[:,0],C[:,1])),shape=(5,36))
# convert sparse to dense matrix
A = csr_matrix(A).todense()
B = csr_matrix(B).todense()
C = csr_matrix(C).todense()
D = None
# get dimensions
nx=np.size(A,0)
ny=np.size(B,1)
nu=np.size(C,0)
# names, units, and initial condition
# outputs
yn = ['TO.PV','FO.PV','DT.PV','TS1.PV','TS2.PV']
yu = ['DEGF','BPH','DEGF','DEGF','DEGF']
y0 = [750,200,0,882,882]
# inputs
un = ['FC1.SP','FC2.SP','FG.SP','TI1.PV','TI2.PV']
uu = ['BPH','BPH','MSCFH','DEGF','DEGF']
u0 = [100,100,95,540,540]
# create GEKKO state space model
m = GEKKO(remote=False)
x,y,u = m.state_space(A,B,C,D=None)
# step response
nt = 101
m.time = np.linspace(0,nt-1,nt)
m.options.IMODE=4
m.options.NODES=2
m.options.TIME_SHIFT=0
# create step input from 3 min
u[0].value = np.zeros(nt)
u[0].value[3:] = 1
# solve
m.solve(disp=False)
# show input 1 and output 1
plt.plot(m.time,u[0].value,'r--')
plt.plot(m.time,y[0].value,'b-')
plt.show()
Solution
from gekko import GEKKO
from scipy.sparse import csr_matrix
import matplotlib.pyplot as plt
# state space matrices A,B,C
# sparse (row,column,value)
A = np.array(\
[[1,1,-1.5],[2,1,1.0],[1,2,-0.5],[3,3,-1.5],\
[4,3,1.0],[3,4,-0.5],[5,5,-1.3333333],[6,5,1.0],\
[5,6,-.33333333],[7,7,-1.5],[8,7,1.0],\
[7,8,-0.5],[9,9,-1.5],[10,9,1.0],[9,10,-0.5],\
[11,11,-0.5],[12,12,-0.5],[16,16,-0.16666667],\
[17,16,1.0],[16,17,-6.6666667e-03],\
[18,18,-0.16666667],[19,18,1.0],\
[18,19,-6.6666667e-03],[21,21,-1.5],\
[22,21,1.0],[21,22,-0.5],[23,23,-1.5],\
[24,23,1.0],[23,24,-0.5],[25,25,-1.0],\
[27,27,-1.5],[28,27,1.0],[27,28,-0.5],\
[29,29,-1.0],[32,32,-1.0],[33,33,-1.5],\
[34,33,1.0],[33,34,-0.5],[36,36,-1.0]])
B = np.array(\
[[1,1,1],[11,1,1],[16,1,1],[25,1,1],[3,2,1],\
[12,2,1],[18,2,1],[32,2,1],[5,3,1],[27,3,1],\
[33,3,1],[7,4,1],[21,4,1],[29,4,1],[9,5,1],\
[23,5,1],[36,5,1]])
C = np.array(\
[[1,2,-0.4],[1,4,-0.4],[1,6,2],[1,8,0.175],\
[1,10,0.175],[2,11,0.5],[2,12,0.5],\
[3,17,-6.6666667e-03],[3,19,6.6666667e-03],\
[3,22,0.2],[3,24,-0.2],[4,25,-1.2],[4,28,5],\
[4,29,0.8],[5,32,-1.2],[5,34,5],[5,36,0.8]])
# convert one-index to zero-index
A[:,0:2] += -1
B[:,0:2] += -1
C[:,0:2] += -1
# read and convert sparse matrix
A = csr_matrix((A[:,2],(A[:,0],A[:,1])),shape=(36,36))
B = csr_matrix((B[:,2],(B[:,0],B[:,1])),shape=(36,5))
C = csr_matrix((C[:,2],(C[:,0],C[:,1])),shape=(5,36))
# convert sparse to dense matrix
A = csr_matrix(A).todense()
B = csr_matrix(B).todense()
C = csr_matrix(C).todense()
D = None
# get dimensions
nx=np.size(A,0)
ny=np.size(B,1)
nu=np.size(C,0)
# names, units, and initial condition
# outputs
yn = ['TO.PV','FO.PV','DT.PV','TS1.PV','TS2.PV']
yu = ['DEGF','BPH','DEGF','DEGF','DEGF']
y0 = [750,200,0,882,882]
# inputs
un = ['FC1.SP','FC2.SP','FG.SP','TI1.PV','TI2.PV']
uu = ['BPH','BPH','MSCFH','DEGF','DEGF']
u0 = [100,100,95,540,540]
# create a Python plot
plt.figure(figsize=(7,10))
# step test for each input
for iu in range(nu):
# create GEKKO state space model
m = GEKKO(remote=False)
x,y,u = m.state_space(A,B,C,D=None)
# step response
nt = 101
m.time = np.linspace(0,nt-1,nt)
m.options.IMODE=4
m.options.NODES=2
m.options.TIME_SHIFT=0
# create step input from 3 min
u[iu].value = np.zeros(nt)
u[iu].value[3:] = 1
# solve
m.solve(disp=False) # (GUI=True)
# plot
plt.subplot(5,1,iu+1)
plt.plot(m.time,np.array(u[iu].value),'r-',\
label=r'$\Delta$ '+un[iu]+' ('+uu[iu]+')')
for iy in range(ny):
plt.plot(m.time,np.array(y[iy].value),\
label=r'$\Delta$ '+yn[iy]+' ('+yu[iy]+')')
plt.legend(loc=1,fontsize=8)
plt.tight_layout()
plt.xlabel('Time (min)')
plt.savefig('Step_Response.png',dpi=300)
plt.show()
plt.show()
Activity: Model Predictive Control
Test a model predictive controller (MPC) to meet constraints given set point changes and disturbances.
Manipulated Variable (MVs):
- FC1 – pass 1 flow controller setpoint (BPH)
- FC2 – pass 2 flow controller setpoint (BPH)
- FG – fuel gas flow controller setpoint (MSCFH)
Disturbance Variables (DVs):
- TI1 – pass 1 inlet temperature (°F)
- TI2 – pass 2 inlet temperature (°F)
Controlled Variables (CVs):
- TO – combined outlet temperature (°F)
- FO – combined outlet flow (BPH)
- DT – pass outlet temperature difference (°F)
- TS1 – pass 1 tubeskin temperature (°F)
- TS2 – pass 2 tubeskin temperature (°F)
from gekko import GEKKO
from scipy import signal
from scipy.sparse import csr_matrix
import matplotlib.pyplot as plt
import time
# state space matrices A,B,C
# sparse (row,column,value)
A = np.array(\
[[1,1,-1.5],[2,1,1.0],[1,2,-0.5],[3,3,-1.5],\
[4,3,1.0],[3,4,-0.5],[5,5,-1.3333333],[6,5,1.0],\
[5,6,-.33333333],[7,7,-1.5],[8,7,1.0],\
[7,8,-0.5],[9,9,-1.5],[10,9,1.0],[9,10,-0.5],\
[11,11,-0.5],[12,12,-0.5],[16,16,-0.16666667],\
[17,16,1.0],[16,17,-6.6666667e-03],\
[18,18,-0.16666667],[19,18,1.0],\
[18,19,-6.6666667e-03],[21,21,-1.5],\
[22,21,1.0],[21,22,-0.5],[23,23,-1.5],\
[24,23,1.0],[23,24,-0.5],[25,25,-1.0],\
[27,27,-1.5],[28,27,1.0],[27,28,-0.5],\
[29,29,-1.0],[32,32,-1.0],[33,33,-1.5],\
[34,33,1.0],[33,34,-0.5],[36,36,-1.0]])
B = np.array(\
[[1,1,1],[11,1,1],[16,1,1],[25,1,1],[3,2,1],\
[12,2,1],[18,2,1],[32,2,1],[5,3,1],[27,3,1],\
[33,3,1],[7,4,1],[21,4,1],[29,4,1],[9,5,1],\
[23,5,1],[36,5,1]])
C = np.array(\
[[1,2,-0.4],[1,4,-0.4],[1,6,2],[1,8,0.175],\
[1,10,0.175],[2,11,0.5],[2,12,0.5],\
[3,17,-6.6666667e-03],[3,19,6.6666667e-03],\
[3,22,0.2],[3,24,-0.2],[4,25,-1.2],[4,28,5],\
[4,29,0.8],[5,32,-1.2],[5,34,5],[5,36,0.8]])
# convert one-index to zero-index
A[:,0:2] += -1
B[:,0:2] += -1
C[:,0:2] += -1
# read and convert sparse matrix
A = csr_matrix((A[:,2],(A[:,0],A[:,1])),shape=(36,36))
B = csr_matrix((B[:,2],(B[:,0],B[:,1])),shape=(36,5))
C = csr_matrix((C[:,2],(C[:,0],C[:,1])),shape=(5,36))
# convert sparse to dense matrix
A = csr_matrix(A).todense()
B = csr_matrix(B).todense()
C = csr_matrix(C).todense()
D = None
# get dimensions
nx=np.size(A,0)
ny=np.size(B,1)
nu=np.size(C,0)
# names, units, and initial condition
# outputs
yn = ['TO.PV','FO.PV','DT.PV','TS1.PV','TS2.PV']
yu = ['DEGF','BPH','DEGF','DEGF','DEGF']
y0 = [750,200,0,882,882]
ny = len(yn)
# inputs
un = ['FC1.SP','FC2.SP','FG.SP','TI1.PV','TI2.PV']
uu = ['BPH','BPH','MSCFH','DEGF','DEGF']
u0 = [100,100,95,540,540]
nu = len(yu)
# create GEKKO state space model
m = GEKKO(remote=False)
x,y,u = m.state_space(A,B,C,D=None)
# initial values
for i in range(nu):
u[i].MEAS=u0[i]; u[i].FSTATUS=1
# control options
m.options.IMODE=1
m.options.NODES=2
m.solve(disp=False)
# initialize CV BIAS values from SS sim
for i in range(ny):
y[i].BIAS = y0[i] - y[i].value[0]
# control development
m.options.CV_TYPE=1
m.options.MV_TYPE=1
# time horizon
nt = 101
m.time = np.linspace(0,nt-1,nt)
# manipulated variables
FC1,FC2,FG=u[0:3]
FC1.STATUS=1; FC1.FSTATUS=0; FC1.DCOST=0.01
FC2.STATUS=1; FC2.FSTATUS=0; FC2.DCOST=0.01
FG.STATUS =1; FG.FSTATUS =0; FG.DCOST =0.01
# constraints
FC1.LOWER=85; FC1.UPPER=135; FC1.DMAX=100
FC2.LOWER=85; FC2.UPPER=135; FC2.DMAX=100
FG.LOWER=92; FG.UPPER=103; FG.DMAX=100
# disturbances
TI1,TI2=u[3:5]
TI1.STATUS=0; TI1.FSTATUS=1
TI2.STATUS=0; TI2.FSTATUS=1
# controlled variables
TO,FO,DT,TS1,TS2=y
TO.STATUS=1; TO.FSTATUS=0; TO.SPLO=740; TO.SPHI=760
FO.STATUS=1; FO.FSTATUS=0; FO.SPLO=190; FO.SPHI=260
DT.STATUS=1; DT.FSTATUS=0; DT.SPLO=-5; DT.SPHI=5
TS1.STATUS=1; TS1.FSTATUS=0; TS1.SPLO=870; TS1.SPHI=918
TS2.STATUS=1; TS2.FSTATUS=0; TS2.SPLO=870; TS2.SPHI=918
TO.WSPHI=10; TO.WSPLO=10
FO.WSPHI=20; FO.WSPLO=20
DT.WSPHI=5; DT.WSPLO=5
TS1.WSPHI=100; TS1.WSPLO=100
TS2.WSPHI=100; TS2.WSPLO=100
# solve MPC
m.options.IMODE=6
for i in range(10):
time.sleep(1)
if i==2:
TI1.MEAS=530 # inlet temperature drops 10 degF
m.solve(disp=False,GUI=True)
- Use commands in the script or webpage options to change the TO Setpoint from 750 to 755°F and run the script. You should see the control make adjustments to the three MVs to take the TO up to a new setpoint of 755°F. This is accomplished mainly by adjusting the fuel gas flow, although the pass flows are also temporarily decreased in order to help speed up the TO change.
- Change the FO setpoint from 200 to 220 BPH. The control accomplishes this FO setpoint change by increasing the pass flows FC1 and FC2, while simultaneously increasing the fuel gas FG so that that TO stays at its setpoint. FC1 and FC2 are increased in exactly the same way so as to keep the pass temperature difference DT at a setpoint of zero.
- Change the FO setpoint from 220 to 250 BPH. Notice that the control is not able to bring FO all the way up to its new setpoint since this would cause the tubeskin temperatures TS1 and TS2 to exceed maximum limits. The control has been configured to respect the tubeskin temperature limits as a top priority. The next priority is to hold TO at a setpoint, followed by holding FO at a setpoint, with holding DT at a setpoint as the lowest priority.
- Decrease the TO setpoint from 755 to 750°F. Notice that this allows the control to bring FO up to its setpoint while still respecting the tubeskin temperature limits.
- Change the FO setpoint back to 200 BPH. This returns the simulation back to the initial condition.
Additional suggested experiments many additional experiments:
- Test MPC response to disturbances (feedforward control) by adjusting the inlet temperatures TI1 and/or TI2
- Load up the heater again until the tubeskin constraints are active and experiment with other ways to relieve the constraints
- Adjust the controller tuning to speed up or slow down the control response
- Conduct open-loop step-test experiments, collect the data, and identify a step response model.
Acknowledgment
Thanks to Thomas A. Badgwell, PhD, Chief Technology Officer at Collaborative Systems Integration for providing the case study.
