TCLab Temperature Sensor
 |  | |  |  | 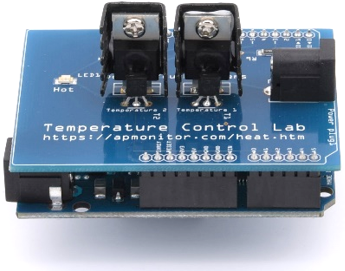 |
|---|
Objective: Use the TMP36 sensor correlation for converting between voltage signal and temperature.
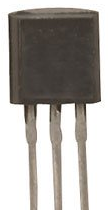
The two temperature sensors on the TCLab are TMP36GZ sensors that report an output voltage (mV) that is linearly proportional to temperature
$$T^oC = 0.1 \, mV-50$$
TMP36 sensor accuracy is `\pm 1^oC` at `25^oC` and `\pm 2^oC` over the range `-40^oC` to `150^oC`. The TMP36 is not a thermistor because it does not have a temperature sensitive resistor. The TMP36 uses the property of diodes that repeatedly change voltage with temperature. The sensor measures the small change and outputs an analog DC voltage between 0 and 1.75V.
- What is the gain, zero, and span of the TMP36?
- What mV signal corresponds to `25^oC`?
- What mV signal corresponds `80^oC`?
- What temperature corresponds to a `0.5V` signal?
- What temperature corresponds to a `1.2V` signal?
- Print the current temperature for `T_1` and `T_2` in Celsius and milliVolts.
Additional Information (Not Required)
The mV is read on the Arduino with a 10-bit Analog to Digital Converter (ADC). There are 210 discrete levels (DL) with a 10-bit ADC between 0 and 3300 mV. The Arduino reports a DL integer between 0 and 1023. This is converted to milliVolts with `mV=DL \frac{3300}{1024}`. The following is a code segment from the firmware (C code) that is loaded on the Arduino.
const int pinT1 = 0;
const int pinT2 = 2;
float mV = 0.0;
float degC = 0.0;
for (int i = 0; i < n; i++) {
mV = (float) analogRead(pinT1) * (3300.0/1024.0);
degC = degC + (mV - 500.0)/10.0;
}
degC = degC / float(n);
Serial.println(degC);
Temperature 1 (T1) is from pin 0 and temperature 2 (T2) is from pin 2 on the Arduino as shown in the instrumentation wiring schematic.
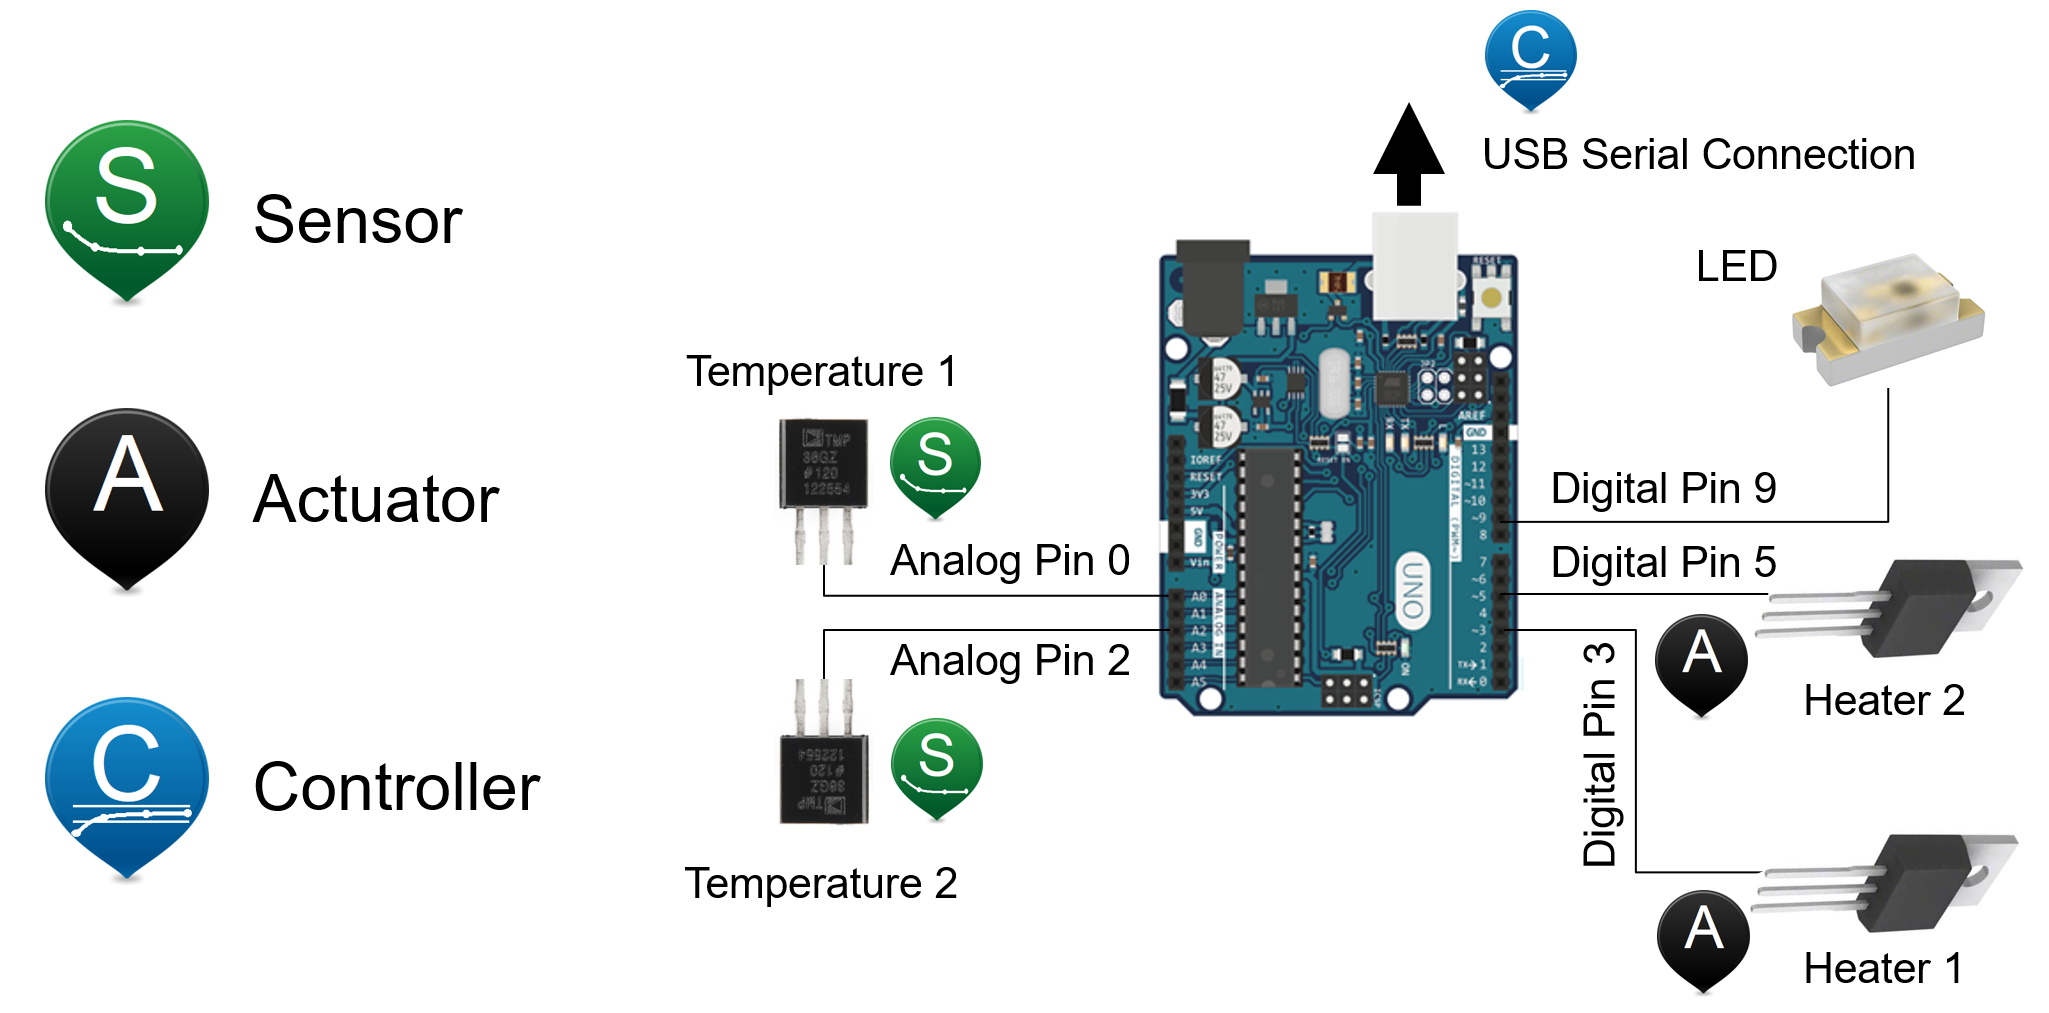
The temperature is read 10 times in rapid succession and then an average is reported over the serial interface. The temperature is reported over the serial (USB) connection when Python requests a value for T1.
import tclab
lab = tclab.TCLab()
print(lab.T1)
lab.close()
Solution
return round(0.1*mV-50.0,1)
def mV(T):
return round((T+50.0)*10.0,2)
print('mV signal at 25 degC: ' + str(mV(25)))
print('mV signal at 80 degC: ' + str(mV(80)))
print('T at 0.5V: ' + str(T(0.5*1000)))
print('T at 1.2V: ' + str(T(1.2*1000)))
print('Current temperature for T1 and T2 in Celsius and milliVolts')
import tclab
lab = tclab.TCLab()
T1 = lab.T1
T2 = lab.T2
T1mV = (T1+50.0)*10.0
T2mV = (T2+50.0)*10.0
print('T1: '+str(T1)+' degC')
print('T2: '+str(T2)+' degC')
print('T1: '+str(round(T1mV))+' mV')
print('T2: '+str(round(T2mV))+' mV')
lab.close()
Generative AI Learning
Use these prompts to test your understanding after completing the exercise. Direct the AI - do not let it do the exercise for you.
App: Observe sensor behavior with the TCLab Control Studio. The app charts show measurement noise at steady state. Compare the simulated sensor to a physical TCLab over Web Serial and estimate the noise band of each.
What to Turn In
- Item 1: Gain, zero, and span of the TMP36 temperature sensor.
- Item 2: Calculated mV signals at 25 °C and 80 °C, and temperatures at 0.5 V and 1.2 V.
- Item 3: Python output showing current T₁ and T₂ in both Celsius and milliVolts.
- Item 4: Screenshot or summary verifying sensor readings and conversions.
- Item 5: 1-2 sentences on how analog voltage is converted to temperature in the Arduino system.
Submit a short report (PDF, 1-2 pages) that curates your results into a demonstration of what you learned. You may use Generative AI to help write the report, but you must guide it to the correct visualizations, justifications, and assumptions. Answer these questions:
- From your data: what is the noise band (max-min at steady state) and the quantization step of the TCLab temperature signal?
- Show the sensor signal chain from junction temperature to the number in Python, with units at each stage (degC, mV, counts, degC).
- Apply a filter (moving average or first-order) to your data: include before/after plots and state the trade-off you observed.
- From the quiz prompt: one question you missed and the corrected answer.