Parameter Regression
 |  |  |  |  |
|---|
The temperature of a subsea pipeline is measured as hot oil reservoir fluids (water mixed with hydrocarbon liquid and gas) begins flowing. The temperature transmitter (TT) is placed near the well-head at the Flowline End Termination (FLET).
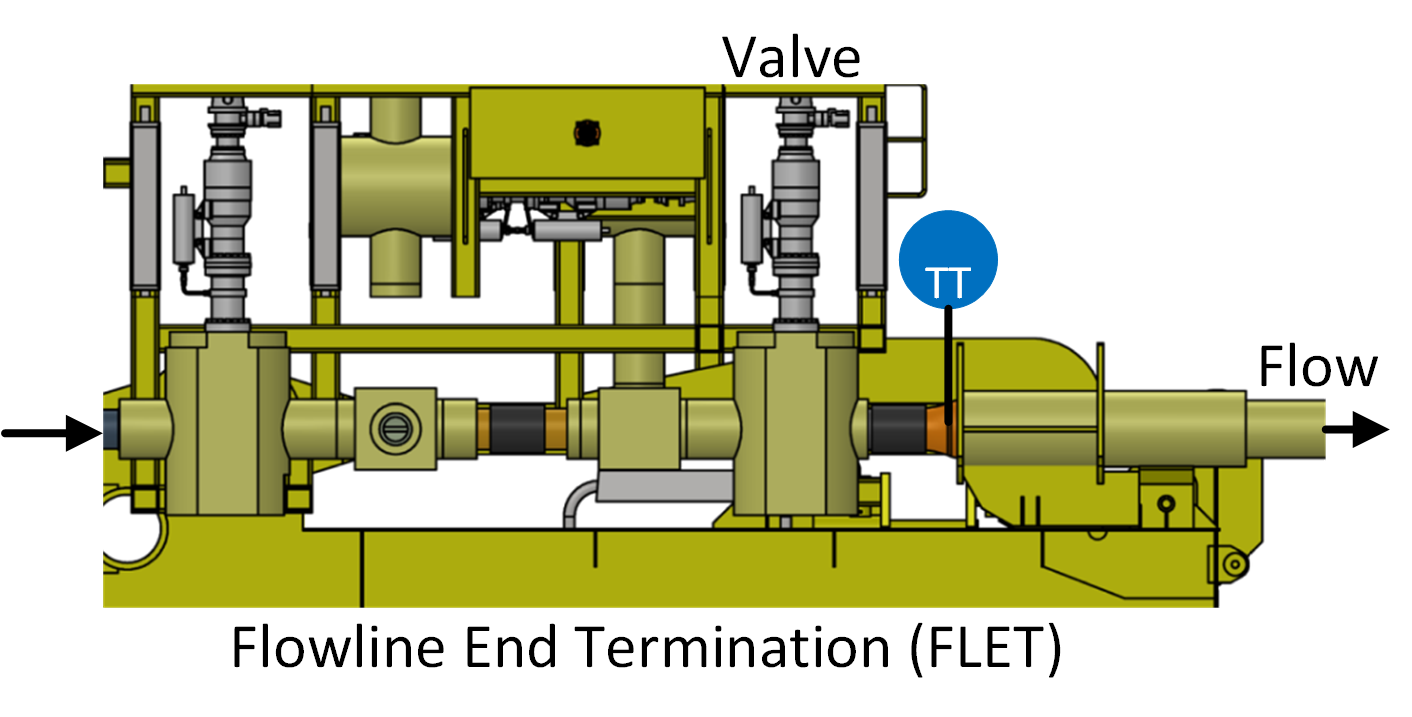
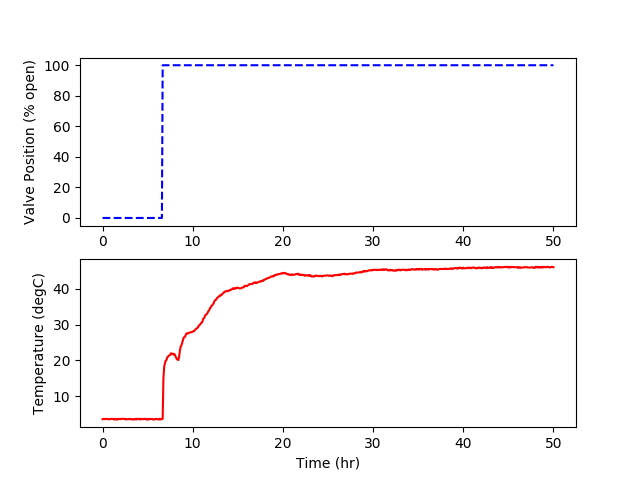
The temperature of the fluid is important to monitor because of the potential for methane hydrates (water and methane) that have the potential to develop under high pressure and cold temperatures. Methanol is added to the fluid to prevent hydrate formation and buildup in the pipeline. If hydrates form and conglomerate, it could lead to pipeline plugging and costly remediation efforts or pipeline abandonment. The following data set is a measurement of fluid temperature during startup of well production. The temperature begins at subsea temperature of 3.6 Celsius and rises over many hours to the well fluid temperature. There is a link to the raw data below with a Python script that automatically downloads the data file and creates plots of the data.
Use the data to develop a first-order plus time delay model with adjustable parameters `K_p, \tau_p, \theta_p`. Use a graphical method and optimization method to obtain the unknown parameters and include the data and the two regression results on a single graph.

import matplotlib.pyplot as plt
# pipeline data URL (don't need wget)
url = 'http://apmonitor.com/pdc/uploads/Main/pipeline_data.txt'
# import data with pandas
data = pd.read_csv(url)
time = 'Time (min)'
valve = 'Valve Position (% open)'
TC = 'Temperature (degC)'
# print temperature values
print(TC)
print(data[TC][0:5])
print('min: '+str(min(data[TC])))
print('max: '+str(max(data[TC])))
# plot data with pyplot
plt.figure()
plt.subplot(2,1,1)
plt.plot(data[time]/60.0,data[valve],'b--')
plt.ylabel(valve)
plt.subplot(2,1,2)
plt.plot(data[time]/60.0,data[TC],'r-')
plt.ylabel(TC)
plt.xlabel('Time (hr)')
plt.show()
Solution
Solution with Excel and SimTune
Reference
- Hedengren, J.D., Brower, D.V., Wilson J.C., High, G., Witherow, K., New Flow Assurance System With High Speed Subsea Fiber Optic Monitoring Of Pressure And Temperature, Symposium 4 Pipelines, Risers, and Subsea Systems, ASME 37th International Conference on Ocean, Offshore and Arctic Engineering, OMAE2018/78079, Madrid, Spain, June 2018. Preprint
Generative AI Learning
Use these prompts to test your understanding after completing the exercise. Direct the AI - it may help with code, but you must own the optimization setup and the interpretation.
App: Build intuition with the Model Fitting and Tuning Studio - hand-tune the sliders to minimize the live objective before running the optimizer. If the optimizer beats your hand tuning by a lot, find out which parameter you had wrong.
What to Turn In
Submit a short report (PDF, 1-2 pages) that curates your results into a demonstration of what you learned. You may use Generative AI to help write the report, but you must guide it to the correct visualizations, justifications, and assumptions. Answer these questions:
- Include the fit plot (data vs optimized model) and report the optimal parameters, the objective value, and the optimizer/initial guess used.
- Compare graphical, hand-tuned (app), and optimized parameters in a table. Which differences matter for control design?
- Show the residual plot and interpret it: noise, or structural mismatch? Justify.
- From the quiz prompt: one question you missed and the corrected answer.