TCLab Radiative Heat Transfer
 |  |  |  |
|---|
Objective: Simulate an energy balance model with radiative and convective heat transfer.
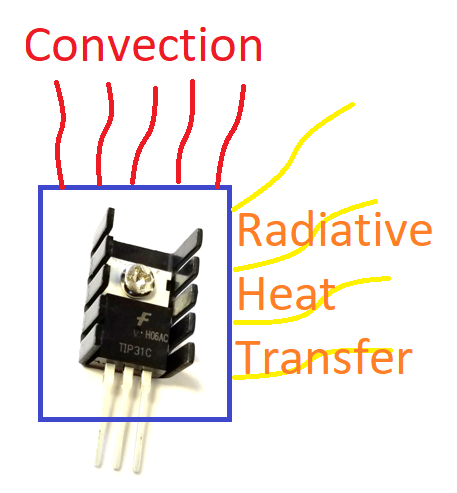
The temperature of the transistor increases as electrical current flows through the small device. Energy is dispersed away from the transistor with two primary mechanisms: convection and radiation. The amount of heat lost by convection `(q_{conv})` is proportional to the temperature difference between the transistor `(T)` and the surrounding air temperature `(T_{a})`.
$$m \, c_p \, \frac{dT}{dt} = U\,A\, \left(T_a-T\right) + \epsilon\,\sigma\,A\,\left(T_\infty^4-T^4\right) + \alpha \, Q$$
The amount of heat lost by radiative heat transfer `(q_{rad})` is proportional to the 4th power of the temperature between the transistor temperature `(T^4)` and the surrounding objects `(T_{\infty}^4)`.
Background on Convective and Radiative Heat Transfer
There are several modes of heat transfer including radiative, convective, and conductive. Radiative heat transfer is from the motion of particles and emitted as electromagnetic photons primarily as infrared radiation. Convective heat transfer is with the surrounding fluid such as air. Convection can be forced such as from a blower or natural such as in quiescent conditions. Conductive heat transfer is through solid contact as the energy transfers away but, unlike convection, the contact material is stationary.
A. Heat Transfer Modes
For each situation, determine which form best describes the heat transfer.
1. Hair is dried with a blow dryer
2. A pan is heated on a gas stove
3. Food is cooked in the hot pan
4. Sunlight warms the ground
B. Heat Transfer with Increased Temperature
What is the relative importance of heat transfer by convection and radiation at low (<30 oC) and high (80 oC) temperature for the transistor. Which heat transfer mode increases relatively more as the temperature increases?
C. Factors that Influence Heat Transfer
Equation for convection heat loss:
$$q_{conv} = U \, A \, \left(T_a-T\right)$$
Equation for radiation heat loss:
$$q_{rad} = \epsilon \, \sigma \, A \, \left(T_\infty^4-T^4\right)$$
Which of these factors increases only thermal radiation?
Which of these factors increases both thermal radiation and convection?
Problem Statement
A finned heat sink is attached to the transistor to increase the surface area and increase the heat removal both by convective and radiative heat transfer. A temperature sensor is attached to the transistor to monitor the temperature.

A lumped parameter energy balance model of the Temperature Control Lab (TCLab) assumes that there is one uniform temperature in the control volume and that all heat loss is through radiative and convective heat transfer. The relationship between the heater and the power output is given by `\alpha`=0.01 W/%.
$$m \, c_p \, \frac{dT}{dt} = U\,A\, \left(T_a-T\right) + \epsilon\,\sigma\,A\,\left(T_\infty^4-T^4\right) + \alpha \, Q$$
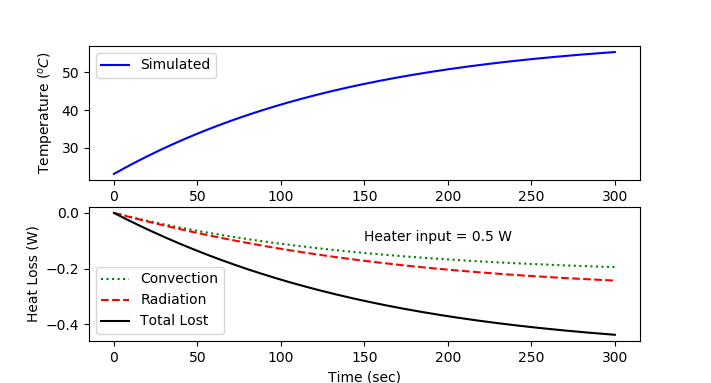
With the temperature initially at ambient temperature (`T_a`), simulate the change in temperature over the 5 minutes when heater Q is adjusted to 50%. Use values of m=0.004 kg, `\epsilon`=0.9, A=0.0012 m2, `c_p`=500 J/kg-K, U=5 W/m2-K, `\sigma`=5.67x10⁻⁸ W/m2-K4 , and `T_\infty = T_a`=23 oC. Compare the simulated temperature response to data from the TCLab. Additionally, show how much heat is lost through convective and radiative heat loss throughout the 5 minute period. Add a simulation prediction to the script below to compare with the TCLab data.
TCLab Step Response
import matplotlib.pyplot as plt
import tclab
import time
n = 300 # Number of second time points (5 min)
tm = np.linspace(0,n,n+1) # Time values
# data
lab = tclab.TCLab()
T1 = [lab.T1]
lab.Q1(50)
for i in range(n):
time.sleep(1)
print(lab.T1)
T1.append(lab.T1)
lab.close()
# Plot results
plt.figure(1)
plt.plot(tm,T1,'r.',label='Measured')
plt.ylabel('Temperature (degC)')
plt.xlabel('Time (sec)')
plt.legend()
plt.show()
Solutions
Connect TCLab to Add Data to Plot

import matplotlib.pyplot as plt
from scipy.integrate import odeint
import tclab
import time
n = 300 # Number of second time points (5 min)
# collect data if TCLab is connected
try:
lab = tclab.TCLab()
T1 = [lab.T1]
lab.Q1(50)
for i in range(n):
time.sleep(1)
print(lab.T1)
T1.append(lab.T1)
lab.close()
connected = True
except:
print('Connect TCLab to Get Data')
connected = False
# simulation
U = 5.0
A = 0.0012
alpha = 0.01
eps = 0.9
sigma = 5.67e-8
Ta = 23
Cp = 500
m = 0.004
TaK = Ta + 273.15
def labsim(TC,t):
TK = TC + 273.15
dTCdt = (U*A*(Ta-TC) + sigma*eps*A*(TaK**4-TK**4) + alpha*50)/(m*Cp)
return dTCdt
tm = np.linspace(0,n,n+1) # Time values
Tsim = odeint(labsim,23,tm)
# calculate losses from conv and rad
conv = U*A*(Ta-Tsim)
rad = sigma*eps*A*(TaK**4-(Tsim+273.15)**4)
loss = conv+rad
gain = alpha*50
# Plot results
plt.figure()
plt.subplot(2,1,1)
plt.plot(tm,Tsim,'b-',label='Simulated')
if connected:
plt.plot(tm,T1,'r.',label='Measured')
plt.ylabel(r'Temperature ($^oC$)')
plt.legend()
plt.subplot(2,1,2)
plt.plot(tm,conv,'g:',label='Convection')
plt.plot(tm,rad,'r--',label='Radiation')
plt.plot(tm,loss,'k-',label='Total Lost')
plt.text(150,-0.1,'Heater input = '+str(gain)+' W')
plt.ylabel(r'Heat Loss (W)')
plt.legend(loc=3)
plt.xlabel('Time (sec)')
plt.show()
Connect TCLab to Add Data to Plot

import matplotlib.pyplot as plt
import tclab
import time
# pip install gekko
from gekko import GEKKO
n = 300 # Number of second time points (5 min)
# collect data if TCLab is connected
try:
lab = tclab.TCLab()
T1 = [lab.T1]
lab.Q1(50)
for i in range(n):
time.sleep(1)
print(lab.T1)
T1.append(lab.T1)
lab.close()
connected = True
except:
print('Connect TCLab to Get Data')
connected = False
# simulation
m = GEKKO()
m.time = np.linspace(0,n,n+1)
U = 5.0; A = 0.0012; Cp = 500
mass = 0.004; alpha = 0.01; Ta = 23
eps = 0.9; sigma = 5.67e-8; TaK = Ta+273.15
TC = m.Var(Ta)
TK = m.Intermediate(TC+273.15)
conv = m.Intermediate(U*A*(Ta-TC))
rad = m.Intermediate(sigma*eps*A*(TaK**4-TK**4))
loss = m.Intermediate(conv + rad)
gain = m.Intermediate(alpha*50)
m.Equation(mass*Cp*TC.dt()==conv+rad+gain)
m.options.NODES = 3
m.options.IMODE = 4 # dynamic simulation
m.solve(disp=False)
# Plot results
plt.figure()
plt.subplot(2,1,1)
plt.plot(m.time,TC,'b-',label='Simulated')
if connected:
plt.plot(m.time,T1,'r.',label='Measured')
plt.ylabel(r'Temperature ($^oC$)')
plt.legend()
plt.subplot(2,1,2)
plt.plot(m.time,conv,'g:',label='Convection')
plt.plot(m.time,rad,'r--',label='Radiation')
plt.plot(m.time,loss,'k-',label='Total Lost')
plt.text(150,-0.1,'Heater input = '+str(gain.value[0])+' W')
plt.ylabel(r'Heat Loss (W)')
plt.legend(loc=3)
plt.xlabel('Time (sec)')
plt.show()
