TCLab Heater Actuators
 |  |  |  |  |
|---|
Objective: Develop and test an FOPDT model for heater 2 and temperature 2 from information about the TCLab actuators (TIP31C transistor heaters).
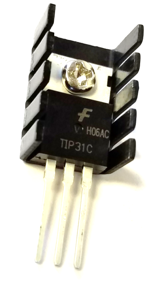
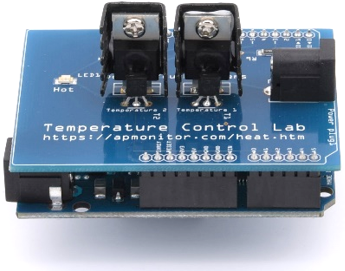
The TCLab actuators are transistor heaters (TIP31C NPN Bipolar Junction Transistors) in package form TO-220. TIP31C BJT transistors are not commonly used as heaters but can expel heat when used in power, audio, and ON/OFF switch applications. To avoid the power loss and subsequent heat generation, a MOSFET transistor is a lower power alternative. If a MOSFET were used instead, it would control the ON/OFF to a resistive power heater. Because the TIP31C does dissipate power, it acts as the heater and the switch. The TIP31C heater is controlled through Pulse Width Modulation (PWM). PWM is one method to emulate an analog output with a digital (ON/OFF) switch. The Arduino cycles from 0 to 100% in rapid succession (500 Hz or every 2 milliseconds). The digital output is 8-bits with 28 discrete levels represented as integers between 0 and 255. The transistor heater can be set between 0 and 100% output by the Arduino such as Q1 to 65% for 10 seconds and Q2 to 85% for 5 seconds.
import tclab
lab = tclab.TCLab()
lab.Q1(65)
time.sleep(10)
lab.Q2(85)
time.sleep(5)
lab.close()
The maximum power output of the heater with a 5V power supply is about 1 Watt. Some of the power from the supply is dissipated over the power cable wire that has a thickness of 20 American Wire Gauge (AWG). The power cable connects the USB power source (either a computer port or the power supply) to the TCLab shield to provide a source for the heat generation. The TCLab has two heaters (Q1 and Q2). The heaters are set to different power levels in the Arduino firmware. This is by design to make the gain for heater 1 and heater 2 different. When heater 1 is set to 100%, a signal of 200 out of 255 is sent to the Arduino. When heater 2 is set to 100%, a signal of 100 out of 255 is sent to the Arduino for half the power of heater 1.
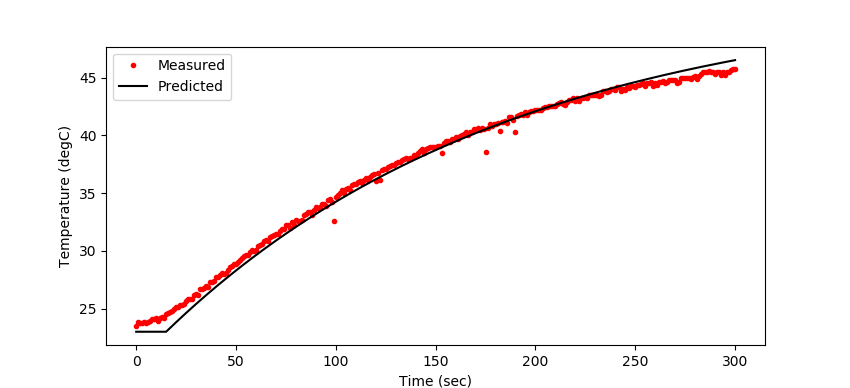
Use this information to develop a FOPDT model for heater 2 and temperature 2 based on the FOPDT model for heater 1 and temperature 1. Evaluate the derived model with a step test to compare measured and predicted values.
taup2 =
thetap2 =
import matplotlib.pyplot as plt
import tclab
import time
n = 300 # Number of second time points (5 min)
tm = np.linspace(0,n,n+1) # Time values
Kp2 =
taup2 =
thetap2 =
Tss = 23.0
Qstep = 65
# step response simulation
T2s = Kp2 * (1-np.exp(-(tm-thetap2)/taup2)) * Qstep
# time delay
step = np.zeros(n+1)
step[int(np.floor(thetap2)):]=1.0
T2s = T2s * step + Tss
# step response data
lab = tclab.TCLab()
T2 = [lab.T2]
lab.Q2(Qstep)
for i in range(n):
time.sleep(1)
print(i,lab.T2)
T2.append(lab.T2)
lab.close()
# Plot results
plt.figure(figsize=(8,5))
plt.plot(tm,T2,'r.',label='Measured')
plt.plot(tm,T2s,'k-',label='Predicted')
plt.ylabel('Temperature (degC)')
plt.xlabel('Time (sec)')
plt.legend()
plt.savefig('Q2_step_test.png')
plt.show()
import numpy as np
import time
import matplotlib.pyplot as plt
# Heater 1 Model
Kp1 = 0.9 # degC/%
tauP1 = 175.0 # seconds
thetaP1 = 15 # seconds (integer)
# Heater 2 Model
Kp2 = # degC/%
tauP2 = # seconds
thetaP2 = # seconds (integer)
# Steady-State Conditions
Tss = 23 # degC (ambient temperature)
Qss = 0 # % heater
# Connect to Arduino
a = tclab.TCLab()
# Turn LED on
print('LED On')
a.LED(100)
# Run time in minutes
run_time = 10.0
# Number of cycles
loops = int(60.0*run_time)
tm = np.zeros(loops)
# Temperature (K)
T1 = np.ones(loops) * a.T1 # measured T (degC)
T2 = np.ones(loops) * a.T2 # measured T (degC)
# Predictions
Tpl = np.ones(loops) * a.T1
Tp2 = np.ones(loops) * a.T2
# step tests (0 - 100%)
Q1 = np.ones(loops) * 0.0
Q1[350:450] = 20.0
Q2 = np.ones(loops) * 0.0
Q2[10:110] = 50.0
Q2[200:300] = 90.0
Q2[400:500] = 70.0
print('Running Main Loop. Ctrl-C to end.')
print(' Time Q1 Q2 T1 T2')
print('{:6.1f} {:6.2f} {:6.2f} {:6.2f} {:6.2f}'.format(tm[0], \
Q1[0], \
Q2[0], \
T1[0], \
T2[0]))
# Create plot
plt.figure(figsize=(10,7))
plt.ion()
plt.show()
# Main Loop
start_time = time.time()
prev_time = start_time
try:
for i in range(1,loops):
# Sleep time
sleep_max = 1.0
sleep = sleep_max - (time.time() - prev_time)
if sleep>=0.01:
time.sleep(sleep-0.01)
else:
time.sleep(0.01)
# Record time and change in time
t = time.time()
dt = t - prev_time
prev_time = t
tm[i] = t - start_time
# Read temperatures in Kelvin
T1[i] = a.T1
T2[i] = a.T2
# Simulate one time step with FOPDT models
z = np.exp(-dt/tauP1)
Tpl[i] = (Tpl[i-1]-Tss) * z \
+ (Q1[max(0,i-int(thetaP1)-1)]-Qss)*(1-z)*Kp1 \
+ Tss
z = np.exp(-dt/tauP2)
Tp2[i] = (Tp2[i-1]-Tss) * z \
+ (Q2[max(0,i-int(thetaP2)-1)]-Qss)*(1-z)*Kp2 \
+ Tss
# Write output (0-100)
a.Q1(Q1[i])
a.Q2(Q2[i])
# Print line of data
print('{:6.1f} {:6.2f} {:6.2f} {:6.2f} {:6.2f}'.format(tm[i], \
Q1[i], \
Q2[i], \
T1[i], \
T2[i]))
# Plot
plt.clf()
ax=plt.subplot(2,1,1)
ax.grid()
plt.plot(tm[0:i],T1[0:i],'r.',label=r'$T_1$ measured')
plt.plot(tm[0:i],Tpl[0:i],'g:',label=r'$T_1$ FOPDT')
plt.plot(tm[0:i],T2[0:i],'b.',label=r'$T_2$ measured')
plt.plot(tm[0:i],Tp2[0:i],'k--',label=r'$T_2$ FOPDT')
plt.ylabel(r'Temperature ($^o$C)')
plt.legend(loc=2)
ax=plt.subplot(2,1,2)
ax.grid()
plt.plot(tm[0:i],Q1[0:i],'r-',label=r'$Q_1$')
plt.plot(tm[0:i],Q2[0:i],'b:',label=r'$Q_2$')
plt.ylabel('Heaters')
plt.xlabel('Time (sec)')
plt.legend(loc='best')
plt.draw()
plt.pause(0.05)
# Turn off heaters
a.Q1(0)
a.Q2(0)
# Save figure
plt.savefig('heater_test.png')
# Allow user to end loop with Ctrl-C
except KeyboardInterrupt:
# Disconnect from Arduino
a.Q1(0)
a.Q2(0)
plt.savefig('heater_test.png')
print('Shutting down')
a.close()
# Make sure serial connection still closes when there's an error
except:
# Disconnect from Arduino
a.Q1(0)
a.Q2(0)
plt.savefig('heater_test.png')
print('Error: Shutting down')
a.close()
raise
Solution
taup2 = 175.0
thetap2 = 15.0
Tss = 23.0
Qstep = 65
What to Turn In
- FOPDT Parameters (Heater 2 → Temperature 2): Report `K_{p2}`, `\tau_{p2}`, and `\theta_{p2}`, and the method used to identify them (1-2 sentences).
- Step-Test Plot: Upload the measured vs. predicted plot with labeled axes, legend, and the step level noted.
- Short Comparison: 2-3 sentences comparing Heater 2 model parameters to the Heater 1 model (comment on gain, time constant, and dead time).