Maintenance Interval Optimization
Main.MaintenanceInterval History
Hide minor edits - Show changes to markup
m = GEKKO()
m = GEKKO(remote=False)
(:toggle hide mycode button show="Complete Code":) (:div id=mycode:) (:source lang=python:) from gekko import GEKKO import numpy as np import matplotlib.pyplot as plt
- Initialize the Gekko model
m = GEKKO(remote=True)
- Parameters
failure_rate = m.Param(value=0.01) # Failure rate per day cost_maintenance = m.Param(value=1000) # Cost per maintenance cost_failure = m.Param(value=5000) # Cost per failure
- Variables
interval = m.FV(value=90, lb=30, ub=365) # Maintenance interval (days) interval.STATUS = 1 # Allow optimization
- Maintenance cost function: Periodic maintenance cost
maintenance_cost = m.Intermediate(cost_maintenance * (365 / interval))
- Failure cost function: Failures that happen if no maintenance
failures = m.Intermediate(failure_rate * (interval / 2)) # Average failures failure_cost = m.Intermediate(cost_failure * failures)
- Total cost: Sum of maintenance cost and failure cost
total_cost = m.Var() m.Equation(total_cost==maintenance_cost + failure_cost)
- Objective: Minimize the total cost
m.Minimize(total_cost)
- Set solver options
m.options.IMODE = 3 # Steady-state optimization m.options.SOLVER = 1 # APOPT Solver
- Solve the optimization problem
m.solve(disp=True)
- Print optimized maintenance interval
opt = interval.value[0] print(f"Optimized maintenance interval: {opt:.2f} days")
- Create an array of intervals to calculate total costs
intervals = np.linspace(30, 365, 50) total_costs = [] maintenance_costs = [] failure_costs = []
interval.STATUS = 0 for i in intervals:
    interval.value = i
    m.solve(disp=False)  # Solve for each interval value
    total_costs.append(total_cost.value[0])
    maintenance_costs.append(maintenance_cost.value[0])
    failure_costs.append(failure_cost.value[0])
- Plot total cost vs. interval
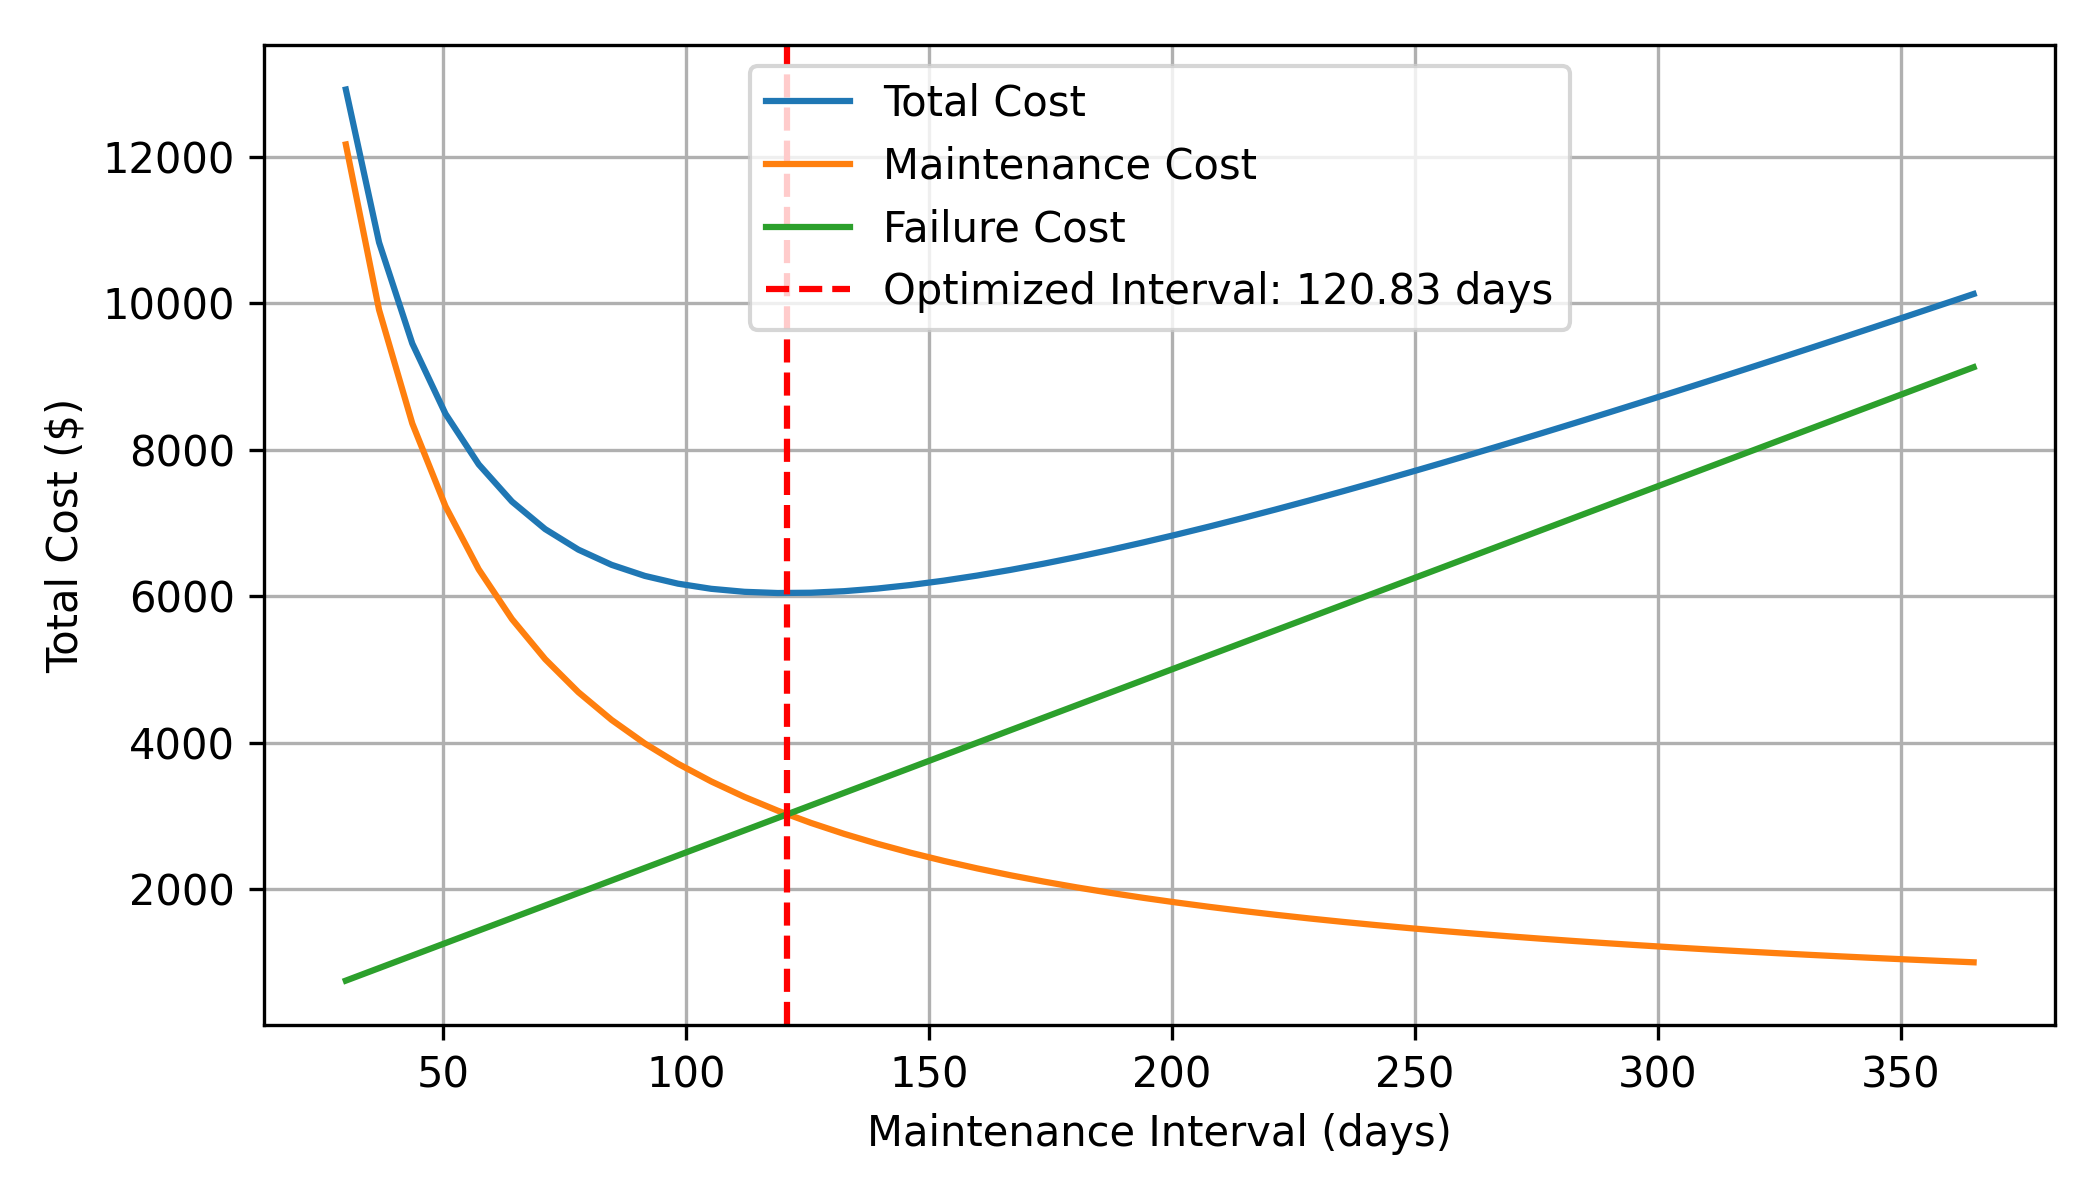
plt.figure(figsize=(7, 4)) plt.plot(intervals, total_costs, label='Total Cost') plt.plot(intervals, maintenance_costs, label='Maintenance Cost') plt.plot(intervals, failure_costs, label='Failure Cost') plt.axvline(opt, color='red', linestyle=,
label=f'Optimized Interval: {opt:.2f} days')
plt.xlabel('Maintenance Interval (days)') plt.ylabel('Total Cost ($)') plt.legend(); plt.grid(True) plt.tight_layout() plt.savefig('total_cost_vs_interval.png', dpi=300) plt.show() (:sourceend:) (:divend:)
plt.figure(figsize=(8, 4))
plt.figure(figsize=(7, 4))
(:sourceend:)
Define Objective: Create the cost functions and the objective to minimize the total cost.
(:source lang=python:)
total_cost = m.Intermediate(maintenance_cost + failure_cost)
total_cost = m.Var() m.Equation(total_cost==maintenance_cost + failure_cost)
m.options.SOLVER = 1 # APOPT Solver
print(f"Optimized maintenance interval: {interval.value[0]:.2f} days")
opt = interval.value[0] print(f"Optimized maintenance interval: {opt:.2f} days")
- Plot the cost breakdown
plt.figure(figsize=(8,4)) plt.bar(['Maintenance Cost', 'Failure Cost'],
[maintenance_cost.value[0], failure_cost.value[0]])
plt.title('Cost Breakdown'); plt.ylabel('Cost ($)') plt.savefig('cost.png',dpi=300); plt.show()
- Create an array of intervals to calculate total costs
intervals = np.linspace(30, 365, 50) total_costs = [] maintenance_costs = [] failure_costs = []
interval.STATUS = 0 for i in intervals:
    interval.value = i
    m.solve(disp=False)  # Solve for each interval value
    total_costs.append(total_cost.value[0])
    maintenance_costs.append(maintenance_cost.value[0])
    failure_costs.append(failure_cost.value[0])
- Plot total cost vs. interval
plt.figure(figsize=(8, 4)) plt.plot(intervals, total_costs, label='Total Cost') plt.plot(intervals, maintenance_costs, label='Maintenance Cost') plt.plot(intervals, failure_costs, label='Failure Cost') plt.axvline(opt, color='red', linestyle=,
label=f'Optimized Interval: {opt:.2f} days')
plt.xlabel('Maintenance Interval (days)') plt.ylabel('Total Cost ($)') plt.legend(); plt.grid(True) plt.savefig('total_cost_vs_interval.png', dpi=300) plt.show()
(:title Maintenance Interval Optimization:) (:keywords optimization, maintenance, chemical plant, refinery, engineering, course:) (:description Optimization of Maintenance Intervals in Manufacturing Facilities using Gekko:)
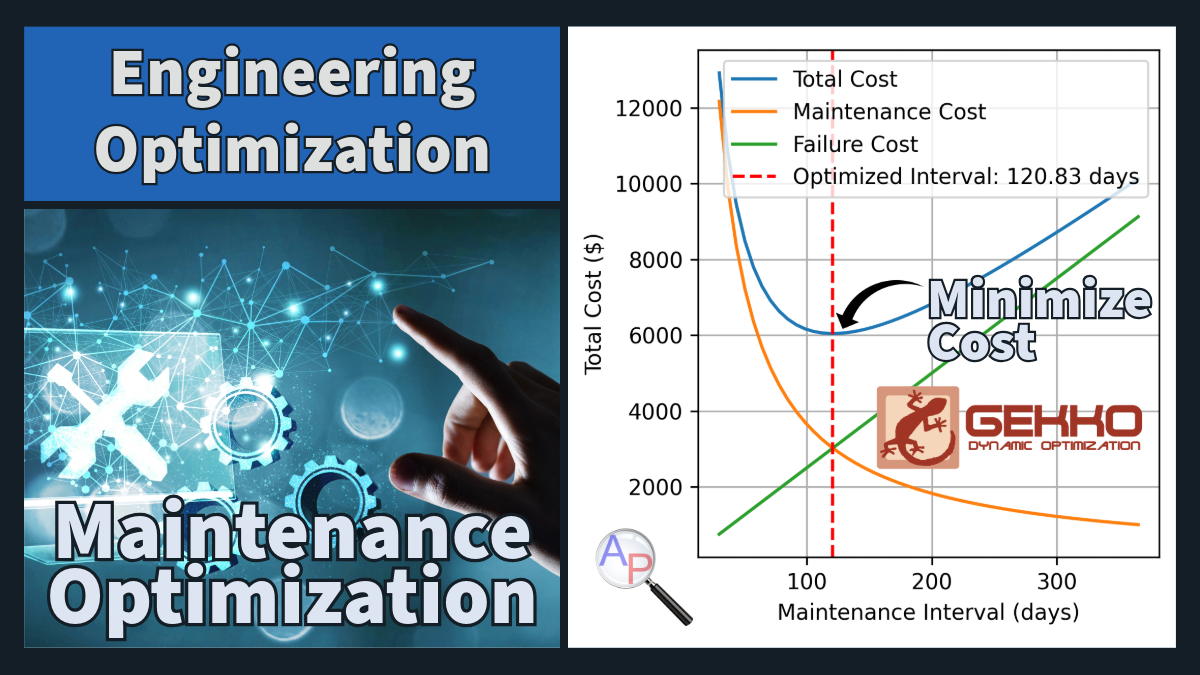
Python Gekko optimization package determines the optimal maintenance intervals in a manufacturing facility to minimize total operational costs. The costs include maintenance costs and failure-related costs when equipment is not maintained on time. The optimization balances between frequent maintenance and reducing downtime due to equipment failure.
Import Libraries: Import the necessary libraries for Gekko and plotting. Install Gekko if not already installed.
(:source lang=python:) from gekko import GEKKO import numpy as np import matplotlib.pyplot as plt
- Initialize the Gekko model
m = GEKKO() (:sourceend:)
Define Parameters: Set up the parameters for the model such as maintenance costs, failure rate, and failure costs.
(:source lang=python:)
- Parameters
failure_rate = m.Param(value=0.01) # Failure rate per day cost_maintenance = m.Param(value=1000) # Cost per maintenance cost_failure = m.Param(value=5000) # Cost per failure (:sourceend:)
Define Variables: The maintenance interval is the decision variable to be optimized.
(:source lang=python:)
- Variables
interval = m.FV(value=90, lb=30, ub=365) # Maintenance interval (days) interval.STATUS = 1 # Allow optimization (:sourceend:)
Define Objective: Create the cost functions and the objective to minimize the total cost.
(:source lang=python:)
- Maintenance cost function: Periodic maintenance cost
maintenance_cost = m.Intermediate(cost_maintenance * (365 / interval))
- Failure cost function: Failures that happen if no maintenance
failures = m.Intermediate(failure_rate * (interval / 2)) # Average failures failure_cost = m.Intermediate(cost_failure * failures)
- Total cost: Sum of maintenance cost and failure cost
total_cost = m.Intermediate(maintenance_cost + failure_cost)
- Objective: Minimize the total cost
m.Minimize(total_cost) (:sourceend:)
Solve the Optimization Problem: Solve the optimization problem to find the optimal maintenance interval.
(:source lang=python:)
- Set solver options
m.options.IMODE = 3 # Steady-state optimization
- Solve the optimization problem
m.solve(disp=True)
- Print optimized maintenance interval
print(f"Optimized maintenance interval: {interval.value[0]:.2f} days") (:sourceend:)
Results Visualization: Plot the cost breakdown to visualize the optimization result.
(:source lang=python:)
- Plot the cost breakdown
plt.figure(figsize=(8,4)) plt.bar(['Maintenance Cost', 'Failure Cost'],
[maintenance_cost.value[0], failure_cost.value[0]])
plt.title('Cost Breakdown'); plt.ylabel('Cost ($)') plt.savefig('cost.png',dpi=300); plt.show() (:sourceend:)
This example demonstrates how to use Gekko to optimize maintenance intervals, balancing the trade-offs between the costs of regular maintenance and potential downtime due to equipment failure. Adjust the parameters such as failure rates, costs, and intervals to fit different industrial scenarios. Turn-around events are much more complex and involve plant-wide maintenance planning during facility shut-down periods. Many maintenance activities are scheduled during those planned outages. For other equipment that doesn't require facility shutdown, regular maintenance schedules can be optimized to trade-off interval with cost of breakdown.
More examples can be found on the Gekko Documentation Page.
