Graphical Method: FOPDT to Step Test
 |  | | |  |  |  |
|---|
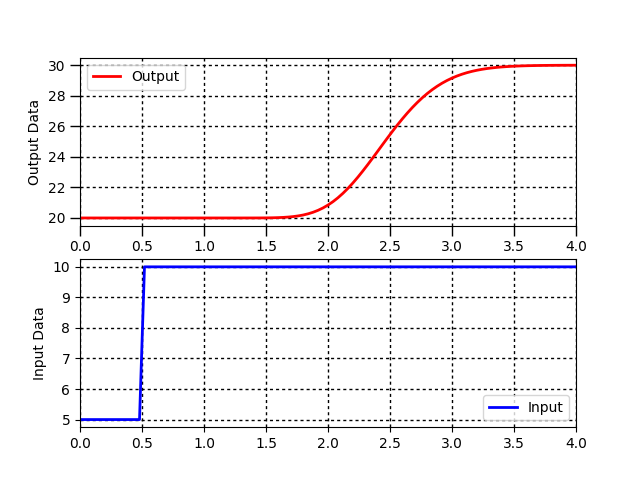
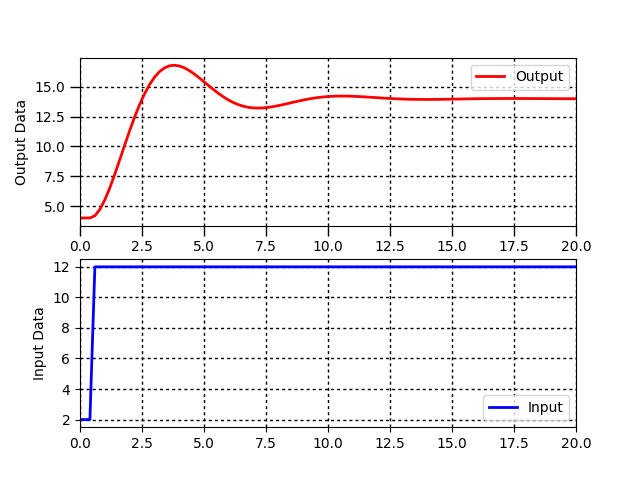
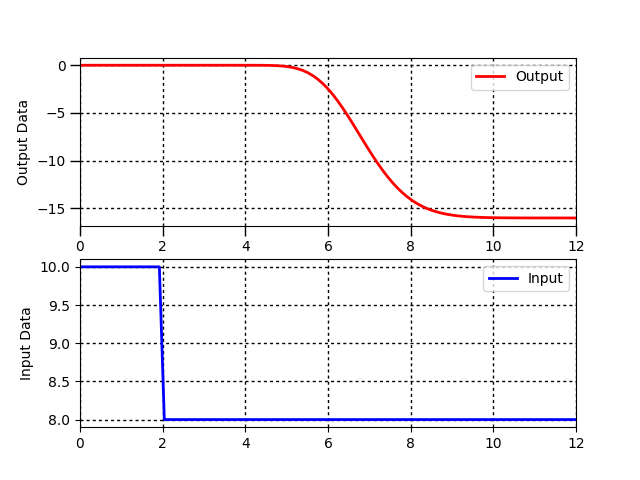
Dynamic processes are often characterized by a gain `(K_c)`, time constant `(\tau_p)`, and sometimes dead-time `(\theta_p)`. Use a graphical fitting method to estimate the three characteristic parameters of the following dynamic systems described by a first-order linear system with time delay.
$$\tau_p \frac{dy(t)}{dt} = -y(t) + K_p u\left(t-\theta_p\right)$$
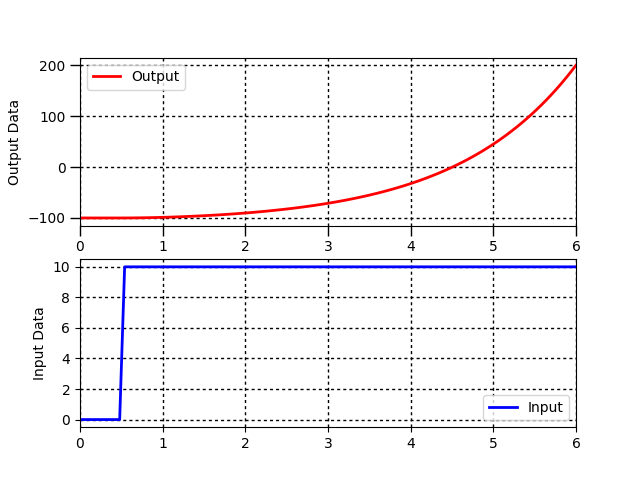
For unstable or oscillatory responses, the first order linear equation does not represent the input to output relationship in the data. Indicate any system responses that are not a good fit for this equation form. Follow the following steps when fitting the parameters `K_p, \tau_p, \theta_p` to a step response.
- Find `\Delta y` from step response
- Find `\Delta u` from step response
- Calculate `K_p = {\Delta y} / {\Delta u}`
- Find `\theta_p`, apparent dead time, from step response
- Find `0.632 \Delta y` from step response
- Find `t_{0.632}` for `y(t_{0.632}) = 0.632 \Delta y` from step response
- Calculate `\tau_p = t_{0.632} - \theta_p`. This assumes that the step starts at `t=0`. If the step happens later, subtract the step time as well.
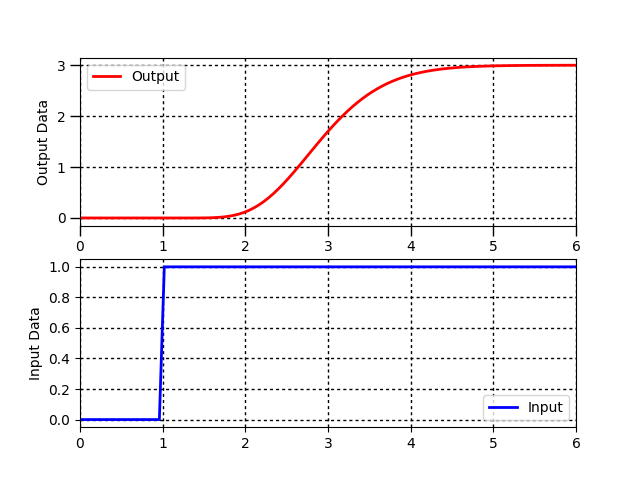
Problem 1
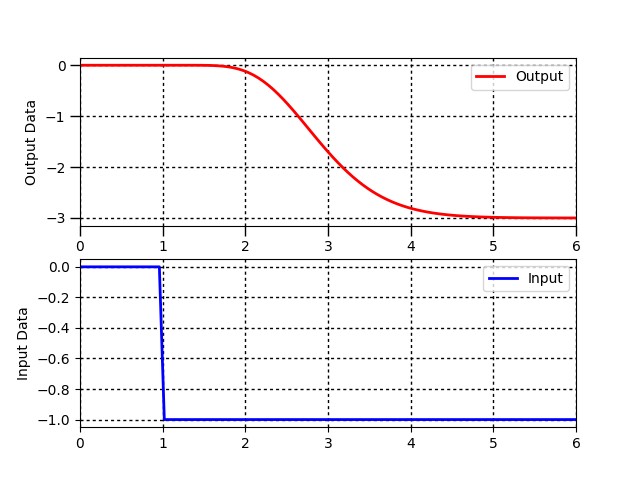
Problem 2
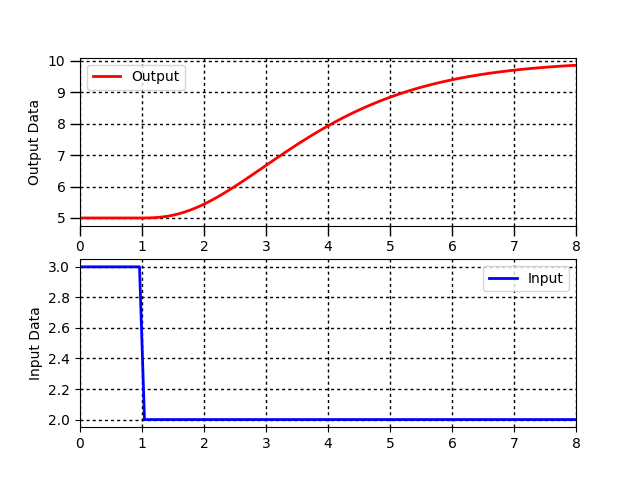
Problem 3
Problem 4
Problem 5
Problem 6
Problem 7
Solution
Generative AI Learning
Use these prompts to test your understanding after completing the exercise. Direct the AI - do not let it read the graphs for you: the graphical readings are the skill being practiced.
App: Practice the same skill on live data with the TCLab Simulation Studio - record a step test and fit Kp, tau-p, theta-p with sliders; the objective value tells you how good your graphical readings were.
What to Turn In
Submit a short report (PDF, 1-2 pages) that curates your results into a demonstration of what you learned. You may use Generative AI to help write the report, but you must supply the correct graphical readings, justifications, and assumptions. Answer these questions:
- Report the FOPDT parameters (with units) for each assigned problem, including one annotated example plot showing delta-u, delta-y, the 63.2% point, and theta-p.
- Which problem was hardest to fit and why (noise, slow drift, ambiguous dead time)? What convention did you adopt and why is it defensible?
- From the AI audit: which of your parameter sets did it flag, and was the flag justified when you re-checked?
- From the quiz prompt: one question you missed and the corrected answer.