Python Elapsed Time Functions
Code in Python is not typically built for speed but it is improved with compilers such as Nuitka, PyPy, and Cython. It often helps to know how long certain sections of code require to run so that those sections can be optimized, parallelized, or compiled.
start = time.time()
# some code to time
end = time.time()
elapsed = end-start
Sometimes a certain section of code is a majority of the run-time so the code may be ported to a compiled language such as C++ or Fortran that is then called from Python, especially if improving a particular section can greatly reduce the total time. That one section may be converted to a langauge that is built for speed and then called by Python. The following tutorial shows to how to implement a simple timer on sections of code.
import timeit
import datetime
def concat1(n):
start = time.time()
time.sleep(0.02)
s = "-".join(str(i) for i in range(n))
end = time.time()
return end-start
def concat2(n):
start = timeit.default_timer()
time.sleep(0.02)
s = "-".join(str(i) for i in range(n))
end = timeit.default_timer()
return end-start
def concat3(n):
start = datetime.datetime.now()
time.sleep(0.02)
s = "-".join(str(i) for i in range(n))
end = datetime.datetime.now()
return (end-start).total_seconds()
def concat4(n):
start = time.process_time()
time.sleep(0.02)
s = "-".join(str(i) for i in range(n))
end = time.process_time()
return end-start
print(timeit.timeit('"-".join(str(i) for i in range(100000))',number=5))
print(concat1(100000))
print(concat2(100000))
print(concat3(100000))
print(concat4(100000))
import numpy as np
x = np.arange(1,1000002,50000)
y1 = np.empty(len(x))
y2 = np.empty(len(x))
y3 = np.empty(len(x))
y4 = np.empty(len(x))
for j,xj in enumerate(x):
y1[j] = concat1(xj)
y2[j] = concat2(xj)
y3[j] = concat3(xj)
y4[j] = concat4(xj)
print(j,xj,y1[j],y2[j],y3[j])
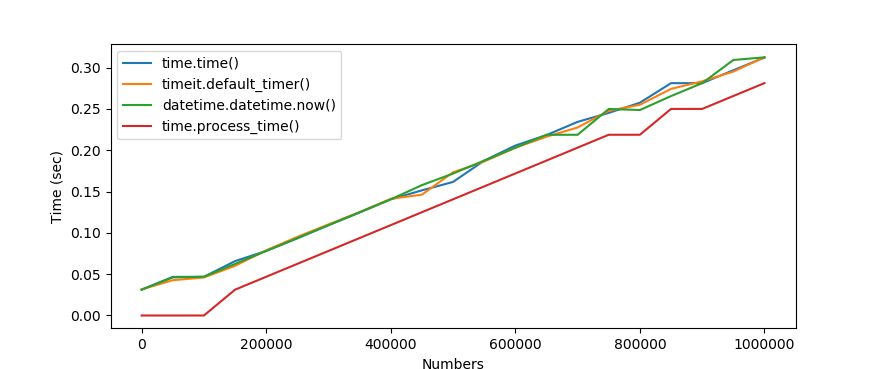
import matplotlib.pyplot as plt
plt.plot(x,y1,label='time.time()')
plt.plot(x,y2,label='timeit.default_timer()')
plt.plot(x,y3,label='datetime.datetime.now()')
plt.plot(x,y4,label='time.process_time()')
plt.legend()
plt.show()
For more complex projects, a profiler such as profile or cProfile maybe a better solution to avoid the extra timer code and for a more comprehensive analysis.
