Pandas with Automotive Data
The purpose of this exercise is to demonstrate the use of Pandas DataFrames to import, cleanse, and view data. Automotive data is available from OBD-II codes that are standard for engine monitoring of light duty vehicles (passenger cars) starting in year 1996. Newer vehicles may include additional sensors from other electronic systems such as the brake system, tire pressure, climate control, and transmission. Data is processed with on-board computers to monitor the health of the vehicle systems and provide warning diagnostics when there is an indication of malfunction.
 Data: Data is collected from a 2014 Ford Focus (manual transmission) and a 2021 Chrysler Pacifica minivan with city and freeway driving:
- Provo to St. George, Utah (~8 hrs), 40 columns, 2014 Ford
- Des Moines to Pella, Iowa (~1 hr), 46 columns, 2021 Chrysler
Data set 1 is collected with the ELM327 module with raw sensor data and calculated values that are collected with Car Scanner (App) from the OBD-II codes through a Bluetooth connection. Data set 2 is collected with an OBDLink MX+ OBD-II module through a Bluetooth connection.
Case Study: GIS Map Visualization
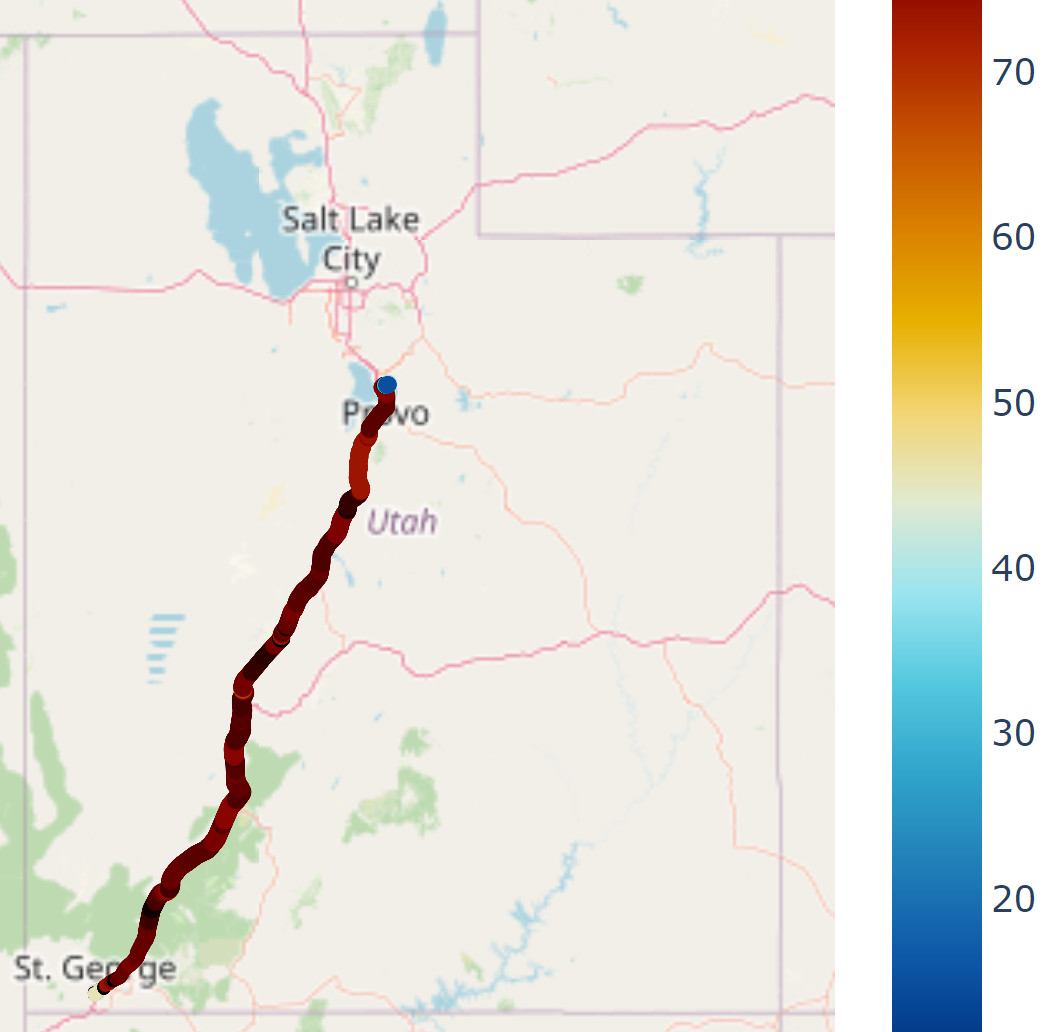
Objective: Import automotive data as a Pandas DataFrame. View the route on a map with the speed and elevation.
Geographic Information Systems (GIS) are used to create, manage, analyze, and map data. GPS is used to identify the location of the vehicle. Car data and location data are in a single data file. This exercise demonstrates the use of Pandas DataFrames to import, cleanse, and view data.


Generative AI Learning
Use these prompts to test your understanding after completing the exercise. Pandas is where specify-generate-verify earns its keep: generated dataframe code looks plausible whether or not it is right, so every result gets checked against a hand calculation on a small slice.
Tip: The verification plan is not optional ceremony. df.describe() on the raw file before and after cleansing is the fastest audit of what your (or the AI's) cleansing actually did - rows dropped, ranges clipped, units changed. The same workflow runs EV battery telemetry and fleet data in industry; the vehicle file here is practice on real, messy data.
What to Turn In
Submit a short report (PDF, 1-2 pages) that curates your results into a demonstration of what you learned. You may use Generative AI to help write the report, but you must guide it to the correct visualizations, justifications, and assumptions. Answer these questions:
- Report the data set you used (which trip file), the number of rows/columns before and after cleansing, and what your cleansing rules removed or fixed - with the df.describe() evidence.
- Include one plot from the data (speed and elevation vs time, or the GPS route map) with labeled axes and units, and one engineering observation it supports.
- Show your verification: the 5 hand-checked rows (or one hand-computed summary statistic) against the pandas result, and the physics sanity check.
- If AI generated any of your code: include your spec and name one assumption it made that you had to correct.
- From the quiz prompt: one question you missed and the corrected answer.
