Lecture Notes 6
Lecture 6 - Fitting models to data
The Gain (K_p), Time Constant (tau_p), and Dead-time (theta_p) can be graphically extracted from a step test when fitting to a First Order Plus Dead Time (FOPDT) model. There are many situations when it is not possible or doesn't make sense to generate a complete step test or there are other model forms that better describe the system.
An FOPDT model can be obtained by fitting the model to data. This allows other forms of step testing such as:
- Pulse: step up followed by step back to original value
- Doublet: two pulses in opposite directions
- Pseudo-Random Binary Sequence (PRBS): steps of varying frequency and magnitude
- Smart-stepping: optimize steps to extract the most information while keeping the process within bounds
In practice, smart-stepping or PRBS signals are used for identification of models for multivariable control. For tuning of PID controllers a step, doublet, or pulse test is often preferred.
Linear vs. Nonlinear Models
One example of comparing linear and nonlinear models is with the following gravity drained tank application.

Fig 1: Diagram of the Gravity Drained Tank
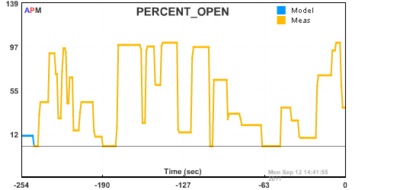
Fig 2: Sequence of Valve Movements to Test Models
Half of the class derived a FOPDT model of the process using empirical fitting techniques. The other half of the class used a material balance to obtain a model. A comparison of the two models is shown below:
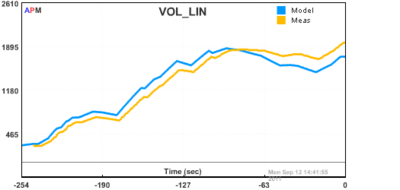
Fig 3: Linear Model (FOPDT). The linear response is easy to fit to the data but deviates, especially during the periods that are far from the steady state values.
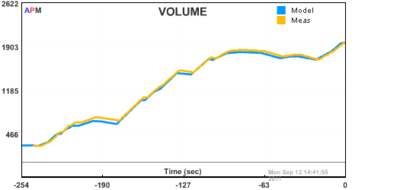
Fig 4: Nonlinear Model Based on a Material Balance. The nonlinear response is valid over a wider range of operation.
