The TCLab is a hands-on application of machine learning and advanced temperature control with two heaters and two temperature sensors. The labs reinforce principles of model development, estimation, and advanced control methods. This is the eighth exercise and it involves adaptive model predictive control with parameters that are updated with a Moving Horizon Estimator (MHE). This model predictive controller uses the MHE parameters and a nonlinear MIMO (Multiple Input, Multiple Output) model of the TCLab input to output response to control temperatures to a set point.
Lab Problem Statement
Solution for Combined MHE and MPC
Physics-based Machine Learning with MPC
import numpy as np
import time
import matplotlib.pyplot as plt
from gekko import GEKKO
# Connect to Arduino
a = tclab.TCLab()
# Get Version
print(a.version)
# Turn LED on
print('LED On')
a.LED(100)
# Run time in minutes
run_time = 15.0
# Number of cycles with 3 second intervals
loops = int(20.0*run_time)
tm = np.zeros(loops)
# Temperature (K)
T1 = np.ones(loops) * a.T1 # temperature (degC)
T1mhe = np.ones(loops) * a.T1 # temperature (degC)
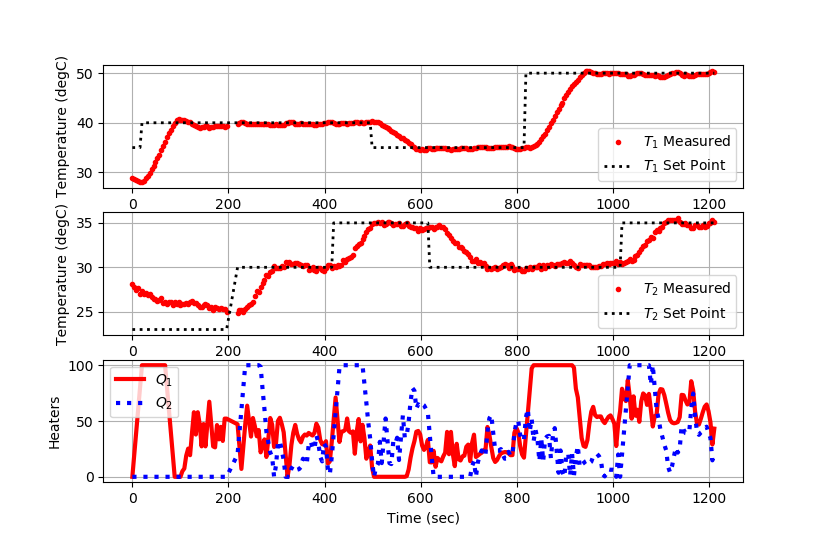
Tsp1 = np.ones(loops) * 35.0 # set point (degC)
T2 = np.ones(loops) * a.T2 # temperature (degC)
T2mhe = np.ones(loops) * a.T1 # temperature (degC)
Tsp2 = np.ones(loops) * 23.0 # set point (degC)
# Set point changes
Tsp1[5:] = 40.0
Tsp1[120:] = 35.0
Tsp1[200:] = 50.0
Tsp2[50:] = 30.0
Tsp2[100:] = 35.0
Tsp2[150:] = 30.0
Tsp2[250:] = 35.0
# heater values
Q1s = np.ones(loops) * 0.0
Q2s = np.ones(loops) * 0.0
#########################################################
# Initialize Models
#########################################################
# Fixed Parameters
mass = 4.0/1000.0 # kg
Cp = 0.5*1000.0 # J/kg-K
A = 10.0/100.0**2 # Area not between heaters in m^2
As = 2.0/100.0**2 # Area between heaters in m^2
eps = 0.9 # Emissivity
sigma = 5.67e-8 # Stefan-Boltzmann
# initialize MHE and MPC
mhe = GEKKO(name='tclab-mhe',remote=False)
mpc = GEKKO(name='tclab-mpc',remote=False)
# create 2 models (MHE and MPC) in loop
for m in [mhe,mpc]:
# Adjustable Parameters
# heat transfer (W/m2-K)
m.U = m.FV(value=2.76,lb=1.0,ub=5.0)
# time constant (sec)
m.tau = m.FV(value=8.89,lb=5,ub=15)
# W / % heater
m.alpha1 = m.FV(value=0.005,lb=0.002,ub=0.010)
# W / % heater
m.alpha2 = m.FV(value=0.0026,lb=0.001,ub=0.005)
# degC
m.Ta = m.FV(value=22.8,lb=15.0,ub=25.0)
# Manipulated variables
m.Q1 = m.MV(value=0)
m.Q1.LOWER = 0.0
m.Q1.UPPER = 100.0
m.Q2 = m.MV(value=0)
m.Q2.LOWER = 0.0
m.Q2.UPPER = 100.0
# Controlled variables
m.TC1 = m.CV(value=T1[0])
m.TC2 = m.CV(value=T2[0])
# State variables
m.TH1 = m.SV(value=T1[0])
m.TH2 = m.SV(value=T2[0])
# Heater temperatures
m.T1i = m.Intermediate(m.TH1+273.15)
m.T2i = m.Intermediate(m.TH2+273.15)
m.TaK = m.Intermediate(m.Ta+273.15)
# Heat transfer between two heaters
m.Q_C12 = m.Intermediate(m.U*As*(m.T2i-m.T1i)) # Convective
m.Q_R12 = m.Intermediate(eps*sigma*As\
*(m.T2i**4-m.T1i**4)) # Radiative
# Semi-fundamental correlations (energy balances)
m.Equation(mass*Cp*m.TH1.dt() == m.U*A*(m.TaK-m.T1i) \
+ eps * sigma * A * (m.TaK**4 - m.T1i**4) \
+ m.Q_C12 + m.Q_R12 \
+ m.alpha1 * m.Q1)
m.Equation(mass*Cp*m.TH2.dt() == m.U*A*(m.TaK-m.T2i) \
+ eps * sigma * A * (m.TaK**4 - m.T2i**4) \
- m.Q_C12 - m.Q_R12 \
+ m.alpha2 * m.Q2)
# Empirical correlations (lag equations to emulate conduction)
m.Equation(m.tau * m.TC1.dt() == -m.TC1 + m.TH1)
m.Equation(m.tau * m.TC2.dt() == -m.TC2 + m.TH2)
##################################################################
# Configure MHE
# 120 second time horizon, steps of 4 sec
mhe.time = np.linspace(0,120,31)
#mhe.server = 'http://127.0.0.1' # solve locally
# FV tuning
# update FVs with estimator
mhe.U.STATUS = 1
mhe.tau.STATUS = 0
mhe.alpha1.STATUS = 0
mhe.alpha2.STATUS = 0
mhe.Ta.STATUS = 0
# FVs are predicted, not measured
mhe.U.FSTATUS = 0
mhe.tau.FSTATUS = 0
mhe.alpha1.FSTATUS = 0
mhe.alpha2.FSTATUS = 0
mhe.Ta.FSTATUS = 0
# MV tuning
mhe.Q1.STATUS = 0 # not optimized in estimator
mhe.Q1.FSTATUS = 0 # receive heater measurement
mhe.Q2.STATUS = 0 # not optimized in estimator
mhe.Q2.FSTATUS = 0 # receive heater measurement
# CV tuning
mhe.TC1.STATUS = 0 # not needed for estimator
mhe.TC1.FSTATUS = 1 # receive measurement
mhe.TC2.STATUS = 0 # not needed for estimator
mhe.TC2.FSTATUS = 1 # receive measurement
# Global Options
mhe.options.IMODE = 5 # MHE
mhe.options.EV_TYPE = 2 # Objective type
mhe.options.NODES = 3 # Collocation nodes
mhe.options.SOLVER = 3 # 1=APOPT, 3=IPOPT
##################################################################
# Configure MPC
# 60 second time horizon, 4 sec cycle time, non-uniform
mpc.time = [0,4,8,12,15,20,25,30,35,40,50,60,70,80,90]
#mpc.server = 'http://127.0.0.1' # solve locally
# FV tuning
# don't update FVs with controller
mpc.U.STATUS = 0
mpc.tau.STATUS = 0
mpc.alpha1.STATUS = 0
mpc.alpha2.STATUS = 0
mpc.Ta.STATUS = 0
# controller uses measured values from estimator
mpc.U.FSTATUS = 1
mpc.tau.FSTATUS = 1
mpc.alpha1.FSTATUS = 1
mpc.alpha2.FSTATUS = 1
mpc.Ta.FSTATUS = 1
# MV tuning
mpc.Q1.STATUS = 1 # use to control temperature
mpc.Q1.FSTATUS = 0 # no feedback measurement
mpc.Q1.DMAX = 20.0
mpc.Q1.DCOST = 0.1
mpc.Q1.COST = 0.0
mpc.Q1.DCOST = 0.0
mpc.Q2.STATUS = 1 # use to control temperature
mpc.Q2.FSTATUS = 0 # no feedback measurement
mpc.Q2.DMAX = 20.0
mpc.Q2.DCOST = 0.1
mpc.Q2.COST = 0.0
mpc.Q2.DCOST = 0.0
# CV tuning
mpc.TC1.STATUS = 1 # minimize error with setpoint range
mpc.TC1.FSTATUS = 1 # receive measurement
mpc.TC1.TR_INIT = 2 # reference trajectory
mpc.TC1.TAU = 10 # time constant for response
mpc.TC2.STATUS = 1 # minimize error with setpoint range
mpc.TC2.FSTATUS = 1 # receive measurement
mpc.TC2.TR_INIT = 2 # reference trajectory
mpc.TC2.TAU = 10 # time constant for response
# Global Options
mpc.options.IMODE = 6 # MPC
mpc.options.CV_TYPE = 1 # Objective type
mpc.options.NODES = 3 # Collocation nodes
mpc.options.SOLVER = 3 # 1=APOPT, 3=IPOPT
##################################################################
# Create plot
plt.figure()
plt.ion()
plt.show()
# Main Loop
start_time = time.time()
prev_time = start_time
try:
for i in range(1,loops):
# Sleep time
sleep_max = 4.0
sleep = sleep_max - (time.time() - prev_time)
if sleep>=0.01:
time.sleep(sleep)
else:
print('Warning: cycle time too fast')
print('Requested: ' + str(sleep_max))
print('Actual: ' + str(time.time() - prev_time))
time.sleep(0.01)
# Record time and change in time
t = time.time()
dt = t - prev_time
prev_time = t
tm[i] = t - start_time
# Read temperatures in degC
T1[i] = a.T1
T2[i] = a.T2
#################################
### Moving Horizon Estimation ###
#################################
# Measured values
mhe.Q1.MEAS = Q1s[i-1]
mhe.Q2.MEAS = Q2s[i-1]
# Temperatures from Arduino
mhe.TC1.MEAS = T1[i]
mhe.TC2.MEAS = T2[i]
# solve MHE
mhe.solve(disp=False)
# Parameters from MHE to MPC (if successful)
if (mhe.options.APPSTATUS==1):
# FVs
mpc.U.MEAS = mhe.U.NEWVAL
mpc.tau.MEAS = mhe.tau.NEWVAL
mpc.alpha1.MEAS = mhe.alpha1.NEWVAL
mpc.alpha2.MEAS = mhe.alpha2.NEWVAL
mpc.Ta.MEAS = mhe.Ta.NEWVAL
# CVs
T1mhe[i] = mhe.TC1.MODEL
T2mhe[i] = mhe.TC2.MODEL
else:
print("MHE failed to solve, don't update parameters")
T1mhe[i] = np.nan
T2mhe[i] = np.nan
#################################
### Model Predictive Control ###
#################################
# Temperatures from Arduino
mpc.TC1.MEAS = T1[i]
mpc.TC2.MEAS = T2[i]
# input setpoint with deadband +/- DT
DT = 0.2
mpc.TC1.SPHI = Tsp1[i] + DT
mpc.TC1.SPLO = Tsp1[i] - DT
mpc.TC2.SPHI = Tsp2[i] + DT
mpc.TC2.SPLO = Tsp2[i] - DT
# solve MPC
mpc.solve(disp=False)
# test for successful solution
if (mpc.options.APPSTATUS==1):
# retrieve the first Q value
Q1s[i] = mpc.Q1.NEWVAL
Q2s[i] = mpc.Q2.NEWVAL
else:
# not successful, set heater to zero
print("MPC failed to solve, heaters off")
Q1s[i] = 0
Q2s[i] = 0
# Write output (0-100)
a.Q1(Q1s[i])
a.Q2(Q2s[i])
# Plot
plt.clf()
ax=plt.subplot(3,1,1)
ax.grid()
plt.plot(tm[0:i],T1[0:i],'ro',MarkerSize=3,label=r'$T_1$ Measured')
plt.plot(tm[0:i],Tsp1[0:i],'k:',lw=2,label=r'$T_1$ Set Point')
plt.ylabel('Temperature (degC)')
plt.legend(loc='best')
ax=plt.subplot(3,1,2)
ax.grid()
plt.plot(tm[0:i],T2[0:i],'ro',MarkerSize=3,label=r'$T_2$ Measured')
plt.plot(tm[0:i],Tsp2[0:i],'k:',lw=2,label=r'$T_2$ Set Point')
plt.ylabel('Temperature (degC)')
plt.legend(loc='best')
ax=plt.subplot(3,1,3)
ax.grid()
plt.plot(tm[0:i],Q1s[0:i],'r-',lw=3,label=r'$Q_1$')
plt.plot(tm[0:i],Q2s[0:i],'b:',lw=3,label=r'$Q_2$')
plt.ylabel('Heaters')
plt.xlabel('Time (sec)')
plt.legend(loc='best')
plt.draw()
plt.pause(0.05)
# Turn off heaters
a.Q1(0)
a.Q2(0)
print('Shutting down')
# Allow user to end loop with Ctrl-C
except KeyboardInterrupt:
# Disconnect from Arduino
a.Q1(0)
a.Q2(0)
print('Shutting down')
a.close()
# Make sure serial connection still closes when there's an error
except:
# Disconnect from Arduino
a.Q1(0)
a.Q2(0)
print('Error: Shutting down')
a.close()
raise
Empirical Machine Learning with MPC
Note: Switch to make_mp4 = True to make an MP4 movie animation. This requires imageio and ffmpeg (install available through Python). It creates a folder named figures in your run directory. You can delete this folder after the run is complete.
import time
import matplotlib.pyplot as plt
import random
import json
# get gekko package with:
# pip install gekko
from gekko import GEKKO
# get tclab package with:
# pip install tclab
from tclab import TCLab
# Connect to Arduino
a = TCLab()
# Make an MP4 animation?
make_mp4 = False
if make_mp4:
import imageio # required to make animation
import os
try:
os.mkdir('./figures')
except:
pass
# Final time
tf = 10 # min
# number of data points (every 3 seconds)
n = tf * 20 + 1
# Percent Heater (0-100%)
Q1s = np.zeros(n)
Q2s = np.zeros(n)
# Temperatures (degC)
T1m = a.T1 * np.ones(n)
T2m = a.T2 * np.ones(n)
# Temperature setpoints
T1sp = T1m[0] * np.ones(n)
T2sp = T2m[0] * np.ones(n)
# Heater set point steps about every 150 sec
T1sp[3:] = 40.0
T2sp[40:] = 30.0
T1sp[80:] = 32.0
T2sp[120:] = 35.0
T1sp[160:] = 45.0
#########################################################
# Initialize Models
#########################################################
# with a local server when remote=True
#s='http://127.0.0.1'
mhe = GEKKO(name='tclab-mhe',remote=False)
mpc = GEKKO(name='tclab-mpc',remote=False)
# create 2 models (MHE and MPC) in one loop
for m in [mhe,mpc]:
# Parameters with bounds
m.K1 = m.FV(value=0.607,lb=0.1,ub=1.0)
m.K2 = m.FV(value=0.293,lb=0.1,ub=1.0)
m.K3 = m.FV(value=0.24,lb=0.1,ub=1.0)
m.tau12 = m.FV(value=192,lb=100,ub=200)
m.tau3 = m.FV(value=15,lb=10,ub=20)
m.Ta = m.Param(value=23.0) # degC
m.Q1 = m.MV(value=0,lb=0,ub=100,name='q1')
m.Q2 = m.MV(value=0,lb=0,ub=100,name='q2')
# Heater temperatures
m.TH1 = m.SV(value=T1m[0])
m.TH2 = m.SV(value=T2m[0])
# Sensor temperatures
m.TC1 = m.CV(value=T1m[0],name='tc1')
m.TC2 = m.CV(value=T2m[0],name='tc2')
# Temperature difference between two heaters
m.DT = m.Intermediate(m.TH2-m.TH1)
# Equations
m.Equation(m.tau12*m.TH1.dt()+(m.TH1-m.Ta)==m.K1*m.Q1+m.K3*m.DT)
m.Equation(m.tau12*m.TH2.dt()+(m.TH2-m.Ta)==m.K2*m.Q2-m.K3*m.DT)
m.Equation(m.tau3*m.TC1.dt()+m.TC1==m.TH1)
m.Equation(m.tau3*m.TC2.dt()+m.TC2==m.TH2)
###################################################
# Configure MHE
# 120 second time horizon, steps of 3 sec
ntm = 40
mhe.time = np.linspace(0,ntm*3,ntm+1)
# Measured inputs
mhe.Q1.STATUS = 0 # not changed by mhe
mhe.Q1.FSTATUS = 1 # measured
mhe.Q2.STATUS = 0 # not changed by mhe
mhe.Q2.FSTATUS = 1 # measured
mhe.TC1.FSTATUS = 1 # receive measurement
mhe.TC2.FSTATUS = 1 # receive measurement
meas_gap = 2.0
mhe.TC1.MEAS_GAP = meas_gap # for CV_TYPE = 1
mhe.TC2.MEAS_GAP = meas_gap # for CV_TYPE = 1
mhe.options.IMODE = 5 # MHE Mode
mhe.options.EV_TYPE = 1 # Estimator Objective type
mhe.options.NODES = 3 # Collocation nodes
mhe.options.ICD_CALC = 1 # Calculate initial conditions
mhe.options.SOLVER = 3 # IPOPT
mhe.options.COLDSTART = 0 # COLDSTART on first cycle
###################################################
# Configure MPC
# Control horizon, non-uniform time steps
mpc.time = [0,3,6,10,14,18,22,27,32,38,45,55,65, \
75,90,110,130,150]
# update parameters from mhe
mpc.K1.FSTATUS = 1
mpc.K2.FSTATUS = 1
mpc.K3.FSTATUS = 1
mpc.tau12.FSTATUS = 1
mpc.tau3.FSTATUS = 1
# Measured inputs
mpc.Q1.STATUS = 1 # manipulated
mpc.Q1.FSTATUS = 0 # not measured
mpc.Q1.DMAX = 20.0
mpc.Q1.DCOST = 0.1
mpc.Q2.STATUS = 1 # manipulated
mpc.Q2.FSTATUS = 0 # not measured
mpc.Q2.DMAX = 30.0
mpc.Q2.DCOST = 0.1
mpc.TC1.STATUS = 1 # drive to setpoint
mpc.TC1.FSTATUS = 1 # receive measurement
mpc.TC1.TAU = 40 # response speed (time constant)
mpc.TC1.TR_INIT = 1 # reference trajectory
mpc.TC1.TR_OPEN = 0
mpc.TC2.STATUS = 1 # drive to setpoint
mpc.TC2.FSTATUS = 1 # receive measurement
mpc.TC2.TAU = 0 # response speed (time constant)
mpc.TC2.TR_INIT = 0 # dead-band
mpc.TC2.TR_OPEN = 1
# Global Options
mpc.options.IMODE = 6 # MPC Mode
mpc.options.CV_TYPE = 1 # Controller Objective type
mpc.options.NODES = 3 # Collocation nodes
mpc.options.SOLVER = 3 # IPOPT
mpc.options.COLDSTART = 1 # COLDSTART on first cycle
###########################################
# Create plot
plt.figure(figsize=(10,7))
plt.ion()
plt.show()
# Main Loop
start_time = time.time()
prev_time = start_time
tm = np.zeros(n)
try:
for i in range(1,n-1):
# Sleep time
sleep_max = 3.0
sleep = sleep_max - (time.time() - prev_time)
if sleep>=0.01:
time.sleep(sleep-0.01)
else:
time.sleep(0.01)
# Record time and change in time
t = time.time()
dt = t - prev_time
prev_time = t
tm[i] = t - start_time
# Turn on parameter estimation after 10 cycles
if i==10:
mhe.K1.STATUS = 1
mhe.K2.STATUS = 1
#mhe.K3.STATUS = 1
#mhe.tau12.STATUS = 1
#mhe.tau3.STATUS = 1
# Read temperatures in Celsius
T1m[i] = a.T1
T2m[i] = a.T2
# Insert measurements to MHE
mhe.TC1.MEAS = T1m[i]
mhe.TC2.MEAS = T2m[i]
mhe.Q1.MEAS = Q1s[i]
mhe.Q2.MEAS = Q2s[i]
# Update model parameters with MHE
try:
mhe.solve(disp=False)
# Insert updated parameters to MPC
mpc.K1.MEAS = mhe.K1.NEWVAL
mpc.K2.MEAS = mhe.K2.NEWVAL
mpc.K3.MEAS = mhe.K3.NEWVAL
mpc.tau12.MEAS = mhe.tau12.NEWVAL
mpc.tau3.MEAS = mhe.tau3.NEWVAL
except:
print('MHE solution failed, using prior values')
# Insert temperature measurement for MPC
mpc.TC1.MEAS = mhe.TC1.MODEL # or T1m[i]
mpc.TC2.MEAS = mhe.TC2.MODEL # or T2m[i]
# Adjust setpoints
db1 = 1.0 # dead-band
mpc.TC1.SPHI = T1sp[i] + db1
mpc.TC1.SPLO = T1sp[i] - db1
db2 = 0.5
mpc.TC2.SPHI = T2sp[i] + db2
mpc.TC2.SPLO = T2sp[i] - db2
# Adjust Heaters with MPC
try:
# Solve MPC
mpc.solve(disp=False)
# Retrieve new values
Q1s[i+1] = mpc.Q1.NEWVAL
Q2s[i+1] = mpc.Q2.NEWVAL
# get additional solution information
with open(m.path+'//results.json') as f:
results = json.load(f)
except:
print('MPC solution failed, turn off heaters')
Q1s[i+1] = 0.0
Q2s[i+1] = 0.0
# Write new heater values (0-100)
a.Q1(Q1s[i])
a.Q2(Q2s[i])
# Plot
plt.clf()
j = max(0,i-ntm-1)
ax=plt.subplot(3,1,1)
ax.grid()
ax.axvspan(tm[j], tm[i], alpha=0.2, color='purple')
ax.axvspan(tm[i], tm[i]+mpc.time[-1], alpha=0.2, color='orange')
plt.text(tm[i]+10,46.5,'Future: MPC')
plt.text(tm[j]+1,46.5,'Past: MHE')
ax.fill_between(tm[j:i+1],T1m[j:i+1]-meas_gap/2,\
T1m[j:i+1]+meas_gap/2,alpha=0.5,color='red')
#plt.plot(tm[j:i+1],T1m[j:i+1]+meas_gap/2,'k-',\
# label=r'Meas Gap')
#plt.plot(tm[j:i+1],T1m[j:i+1]-meas_gap/2,'k-',label=None)
plt.plot(tm[0:i+1],T1m[0:i+1],'r.',label=r'$T_1$ measured')
plt.plot(mhe.time-120+tm[i],mhe.TC1.value,'k-',\
lw=2,alpha=0.7,label=r'$T_1$ MHE model')
plt.plot(tm[i]+mpc.time,results['tc1.bcv'],'r-',\
label=r'$T_1$ predicted',lw=3)
plt.plot(tm[i]+mpc.time,results['tc1.tr_hi'],'k--',\
label=r'$T_1$ trajectory')
plt.plot(tm[i]+mpc.time,results['tc1.tr_lo'],'k--')
plt.plot([tm[i],tm[i]],[15,50],'k-')
circle1=plt.Circle((tm[i]+40,25),\
10*mhe.K1.value[0],alpha=0.3,color='red')
ax.add_artist(circle1)
K1v = np.round(mhe.K1.value[0],3)
plt.text(tm[i]+20,22,'K1='+str(K1v))
plt.ylabel('Temperature (degC)')
plt.legend(loc=3)
plt.xlim(0, tm[i]+mpc.time[-1])
plt.ylim(15, 50)
ax=plt.subplot(3,1,2)
ax.grid()
ax.axvspan(tm[j], tm[i], alpha=0.2, color='purple')
ax.axvspan(tm[i], tm[i]+mpc.time[-1], alpha=0.2, color='orange')
plt.text(tm[i]+10,46.5,'Future: MPC')
plt.text(tm[j]+1,46.5,'Past: MHE')
ax.fill_between(tm[j:i+1],T2m[j:i+1]-meas_gap/2,\
T2m[j:i+1]+meas_gap/2,alpha=0.5,color='blue')
#plt.plot(tm[j:i+1],T2m[j:i+1]+meas_gap/2,'k-',\
# label=r'Meas Gap')
#plt.plot(tm[j:i+1],T2m[j:i+1]-meas_gap/2,'k-',label=None)
plt.plot(tm[0:i+1],T2m[0:i+1],'b.',label=r'$T_2$ measured')
plt.plot(mhe.time-120+tm[i],mhe.TC2.value,'k-',\
lw=2,alpha=0.7,label=r'$T_2$ MHE model')
plt.plot(tm[i]+mpc.time,results['tc2.bcv'],'b-',\
label=r'$T_2$ predict',lw=3)
plt.plot(tm[i]+mpc.time,results['tc2.tr_hi'],'k--',\
label=r'$T_2$ range')
plt.plot(tm[i]+mpc.time,results['tc2.tr_lo'],'k--')
plt.plot([tm[i],tm[i]],[15,50],'k-')
circle2=plt.Circle((tm[i]+40,25),\
10*mhe.K2.value[0],alpha=0.3,color='blue')
ax.add_artist(circle2)
K2v = np.round(mhe.K2.value[0],3)
plt.text(tm[i]+20,22,'K2='+str(K2v))
plt.ylabel('Temperature (degC)')
plt.legend(loc=3)
plt.xlim(0, tm[i]+mpc.time[-1])
plt.ylim(15, 50)
ax=plt.subplot(3,1,3)
ax.grid()
ax.axvspan(tm[j], tm[i], alpha=0.2, color='purple')
ax.axvspan(tm[i], tm[i]+mpc.time[-1], alpha=0.2, color='orange')
plt.text(tm[i]-10,55,'Current Time',rotation=90)
plt.plot([tm[i],tm[i]],[0,100],'k-',\
label='Current Time',lw=1)
plt.plot(tm[0:i+1],Q1s[0:i+1],'r.-',\
label=r'$Q_1$ history',lw=2)
plt.plot(tm[i]+mpc.time,mpc.Q1.value,'r-',\
label=r'$Q_1$ plan',lw=3)
plt.plot(tm[0:i+1],Q2s[0:i+1],'b.-',\
label=r'$Q_2$ history',lw=2)
plt.plot(tm[i]+mpc.time,mpc.Q2.value,'b-',
label=r'$Q_2$ plan',lw=3)
plt.plot(tm[i]+mpc.time[1],mpc.Q1.value[1],color='red',\
marker='.',markersize=15)
plt.plot(tm[i]+mpc.time[1],mpc.Q2.value[1],color='blue',\
marker='X',markersize=8)
plt.ylabel('Heaters')
plt.xlabel('Time (sec)')
plt.legend(loc=2)
plt.xlim(0, tm[i]+mpc.time[-1])
plt.ylim(0, 100)
plt.draw()
plt.pause(0.05)
if make_mp4:
filename='./figures/plot_'+str(i+10000)+'.png'
plt.savefig(filename)
# Turn off heaters and close connection
a.Q1(0)
a.Q2(0)
a.close()
# Save figure
plt.savefig('tclab_mhe_mpc.png')
# generate mp4 from png figures in batches of 350
if make_mp4:
images = []
iset = 0
for i in range(1,n-1):
filename='./figures/plot_'+str(i+10000)+'.png'
images.append(imageio.imread(filename))
if ((i+1)%350)==0:
imageio.mimsave('results_'+str(iset)+'.mp4', images)
iset += 1
images = []
if images!=[]:
imageio.mimsave('results_'+str(iset)+'.mp4', images)
# Allow user to end loop with Ctrl-C
except KeyboardInterrupt:
# Turn off heaters and close connection
a.Q1(0)
a.Q2(0)
a.close()
print('Shutting down')
plt.savefig('tclab_mhe_mpc.png')
# Make sure serial connection still closes when there's an error
except:
# Disconnect from Arduino
a.Q1(0)
a.Q2(0)
a.close()
print('Error: Shutting down')
plt.savefig('tclab_mhe_mpc.png')
raise
See also: